
Introduction:
In a fast-paced trading environment, timing your entries and exits is crucial. Peak Seeker is designed to analyze market trends and detect potential tops and bottoms by using a sophisticated mix of technical indicators, volume changes, and price action signals. By leveraging this tool, investors can step away from guesswork and make truly data-driven decisions rather than relying purely on intuition.
Step-by-Step: Understanding Peak Seeker's Market Phases
When scanning the market with Peak Seeker, you'll typically see a curated list of stocks categorized into four critical phases, helping you instantly identify where an asset is in its cycle:
- The Dip: Stocks that have recently suffered declines and may be reaching an absolute bottom, presenting potential value opportunities.
- The Top: Stocks that have surged significantly and might be nearing a sharp trend reversal.
- Forming Bottom: Stocks showing early, actionable signs of recovery after a downtrend.
- Forming Head: Stocks losing upward momentum that may be approaching a peak, signaling a potential time to take profits.
Visualizing the Trend: The Peak Seeker Subchart
When viewing an individual stock, Peak Seeker is seamlessly displayed as a subchart directly below the main price chart. This highly visual representation helps investors understand the current trend behavior and pinpoint potential reversal points at a single glance.
(See examples below)
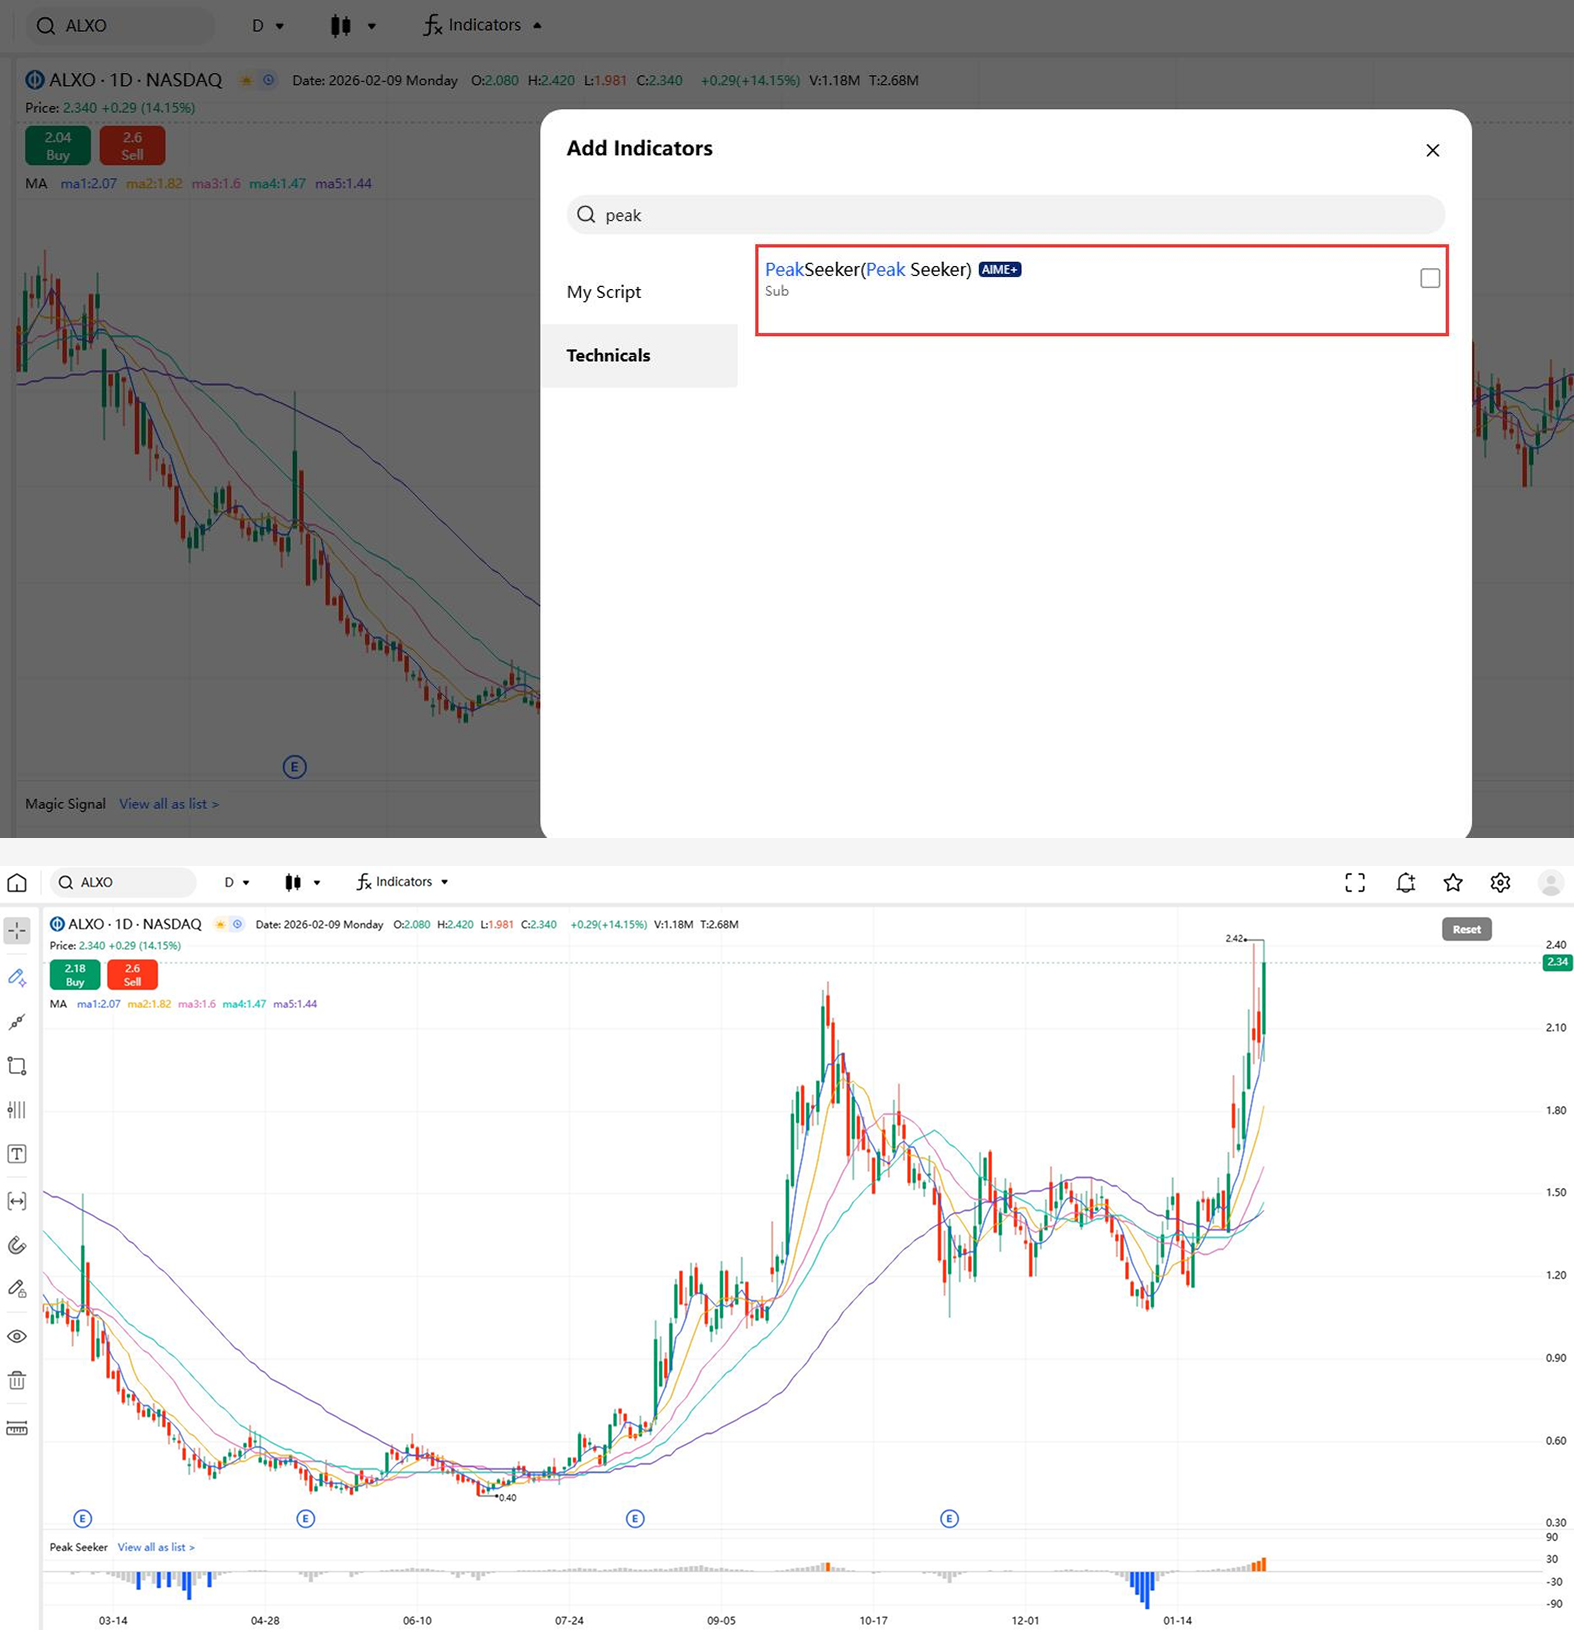
Decoding Peak Seeker Colors and Their Meaning:
To make technical analysis as accessible as possible, the tool condenses complex data into a simple, three-color coding system:
- Orange Bars – "Forming Head": This indicates the stock may be peaking or topping out. It serves as a warning signal that the upward trend is exhausted.
- Blue Bars – "Forming Bottom": This indicates the stock may be bottoming out and getting ready to reverse upward. It serves as a strong signal to watch for potential buying opportunities.
- White Bars – Neutral: There are no strong trend reversal signals at the moment. The stock is likely continuing its current trajectory, and investors should wait for clearer confirmation.
Conclusion: Data-Driven Success
By translating complex volume and price action data into clear visual cues, Peak Seeker removes the noise from technical analysis. Utilizing this subchart allows you to anticipate market pivots before they happen, giving you the professional edge needed to trade with conviction.
