
Introduction: While day trading requires split-second decisions, building sustainable wealth often relies on capturing larger, multi-week or multi-month trends. Magic Signal is a premier trend-following indicator specifically engineered for mid-to-long-term trading strategies (typically spanning a few weeks up to a quarter). By filtering out daily market noise, it provides crystal-clear bullish and bearish signals to help you confidently scale in or out of your positions. The Golden Rule: Not for Intraday Trading Before diving into the strategy, it is crucial to understand how Magic Signal calculates its data: The signal list is updated exclusively at market close. Because it uses end-of-day data to confirm trend shifts, it should never be used for real-time day trading. Instead, it is a strategic tool used to plan your trades for the following trading session.
Decoding the Signals: Visualizing the Trend
Magic Signal simplifies complex trend data into a highly visual, two-color dot system overlaid on your charts:
(Magic Signal Interface Overview:)
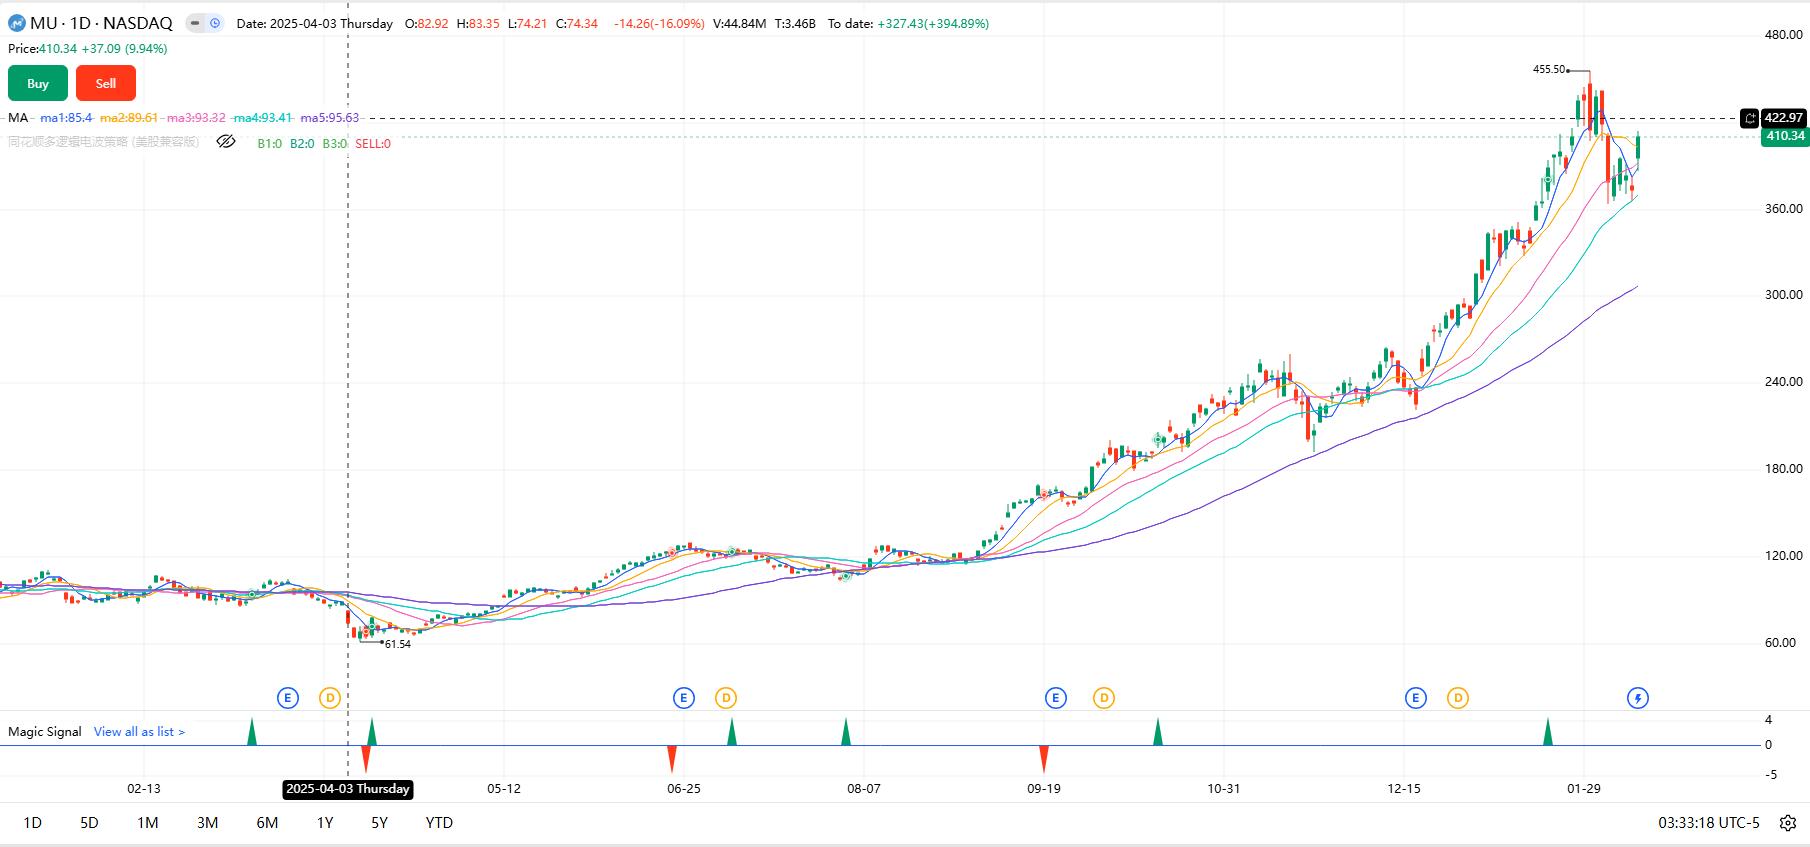
🟢 Green Dot (Bullish Signal): Indicates the start of a potential mid-to-long-term uptrend. This suggests it is time to establish a new position or increase your existing exposure.
🔴 Red Dot (Bearish Signal): Indicates trend exhaustion or an impending downtrend. This is a strong warning to take profits, reduce your position size, or exit entirely to protect capital.
The 4-Step Magic Signal Playbook
To maximize profitability and minimize risk, follow this structured daily routine:
Step 1: The End-of-Day Review
After the closing bell rings, open the updated Magic Signal list. Scan for newly generated green (bullish) and red (bearish) dots. Cross-reference these isolated signals with the broader macroeconomic environment.
Step 2: The Confirmation Matrix
A signal is only as strong as its confirmations. Never trade on Magic Signal alone; layer it with other robust indicators:
- Trend Sight: Does Trend Sight confirm a sustained bullish or bearish phase?
- Moving Averages (MA20, MA50, MA200): Is the stock trading above its key MAs, confirming long-term alignment?
- MACD & RSI: Is momentum genuinely shifting, or is the stock just temporarily overbought/oversold?
- Support & Resistance: Ensure you aren't buying directly into a heavy resistance zone or shorting right above floor support.
Step 3: Next-Day Execution
If a stock passes your confirmation checks, formulate your plan while the market is closed. Decide on your entry point, position size, and strict stop-loss levels. Execute the trade near the open of the next trading session.
Step 4: Weekly Maintenance
Because Magic Signal targets trends lasting up to a quarter, you do not need to watch the ticker every minute. Conduct weekly reviews and adjust your positions gradually rather than making drastic, emotional moves.
Real-World Case Studies
Case Study 1: Riding the Uptrend (TSLA)
- The Signal: Tesla (TSLA) receives a 🟢 Green Dot at market close at $340.
- The Confirmation: You check Trend Sight, which shows a strong "Uptrend Start." The MACD histogram is positive, and the stock has comfortably cleared its 50-day moving average.
- The Action: On Tuesday morning, you enter a long position at the market open with a 3-month holding horizon. You set a strict stop-loss at $320 to protect your downside.
Case Study 2: Protecting Capital (NVDA)
- The Signal: Nvidia (NVDA) receives a 🔴 Red Dot at market close at $480.
- The Confirmation: Trend Sight confirms a weakening trend ("Uptrend End"). The MACD is crossing downward, and the RSI is flashing deeply overbought conditions, signaling a high probability of a reversal.
- The Action: On Thursday morning, you trim your position by 50% or sell completely, locking in your profits before the broader market reacts to the downside risk.
Conclusion:
By integrating Magic Signal's end-of-day precision with confirmation tools like Trend Sight, you eliminate impulsive decisions and replace them with a calm, methodical, and highly profitable long-term trading strategy.
