
The Volatility Term Structure chart plots implied volatility (IV) against expiration dates for one or more strike prices. It reveals how the market prices risk over time -- whether near-term uncertainty is higher or lower than long-term uncertainty. This view is especially useful for identifying event-driven volatility and choosing the right expiration for your trades.
Where to Find It
On the web: Navigate to https://www.ainvest.com/etfs/ARCA-SPY/options/, select the Volatility tab, and look for the Term Structure section.
On mobile: Open the ticker page, tap Options, then select the Analysis sub-tab. Scroll to the Volatility Term Structure chart.
Platform differences: The mobile version displays an interactive chart with multi-strike comparison. You can toggle between Average, Call, and Put views to isolate different perspectives on the term structure.
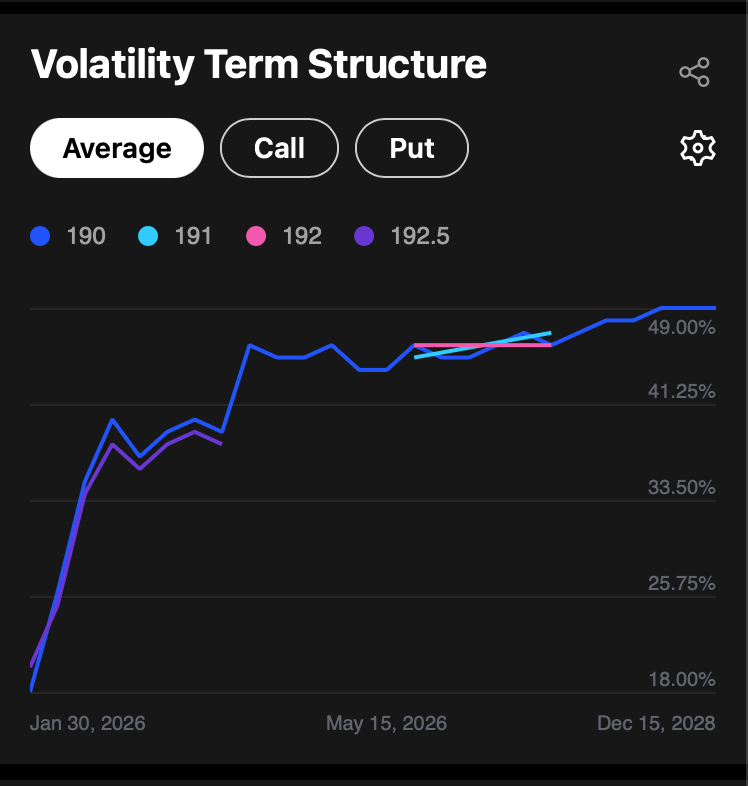
Volatility Term Structure chart showing implied volatility plotted against expiration dates with multiple strike prices overlaid
How It Works
The chart displays the following elements:
- Y-axis: Implied volatility as a percentage (e.g., 18% to 49%)
- X-axis: Expiration dates, spanning from near-term to long-term (e.g., Jan 30, 2026 through Dec 15, 2028)
- Colored lines: Each line represents a different strike price overlaid for comparison (e.g., 190 in blue, 191 in cyan, 192 in pink, 192.5 in purple)
- Toggle controls: Switch between Average, Call, and Put views
- Settings and sharing: Use the gear icon to configure and the share icon to export
How to Read the Data
The term structure reveals two key patterns that every options trader should understand.
Contango (Normal Term Structure)
When IV increases as expirations extend further into the future, the term structure slopes upward from left to right. This is called contango and represents the "normal" state of the volatility market. The logic is straightforward: longer time horizons carry more uncertainty, so the market prices in higher IV for distant expirations.
Backwardation (Inverted Term Structure)
When near-term IV is higher than long-term IV, the term structure slopes downward or shows a pronounced "hump" at a specific expiration. This is called backwardation and signals that the market expects a significant event in the near term -- an earnings announcement, FOMC decision, product launch, or other catalyst. The elevated near-term IV reflects the concentrated risk around that event.
Reading the NVDA Example
From the NVDA term structure chart, several observations stand out:
- Near-term expirations (Jan 30) show relatively low IV of approximately 18-20%, rising steeply through mid-2026
- Long-dated expirations (late 2028) show IV around 49%
- The upward slope is a textbook contango pattern, indicating that no near-term event is causing elevated short-term IV at this snapshot
- All four strike prices (190, 191, 192, 192.5) track closely together, confirming consistent pricing across nearby strikes
Comparing Strikes
When overlaying multiple strikes on the term structure chart, look for these signals:
- Convergence across strikes confirms that IV readings are consistent and reliable. This is the normal case for nearby ATM strikes.
- Divergence at a single strike may indicate concentrated positioning or unusual demand at that specific price level. This warrants further investigation -- check open interest and volume at that strike.
- ATM strikes provide the most liquid and reliable IV readings. Use them as your primary reference.
- Far OTM strikes may produce noisy or unreliable term structures due to wide bid-ask spreads and low trading activity.
Practical Example
Before an earnings announcement, you might observe NVDA's term structure shift into backwardation: the expiration immediately after earnings shows IV of 55%, while the next monthly expiration sits at 38%. This gap represents the market's expectation of a "volatility crush" -- the phenomenon where near-term IV collapses after the event passes and uncertainty resolves.
This has direct strategy implications:
- Selling premium (short straddles, short strangles, iron condors) benefits from the volatility crush. You collect elevated premium before the event and profit as IV contracts afterward -- provided the stock does not move beyond your breakeven points.
- Buying premium (long straddles, long strangles) requires the stock to move enough to overcome both the IV decline and the time decay. The threshold for profitability is higher when you are buying into elevated IV.
Tips for Using the Term Structure
- Check term structure before every trade. Buying options when near-term IV is elevated (backwardation) means paying a premium for volatility that may soon decline. Be sure the expected move justifies the cost.
- Confirm consistency across strikes. Use the multi-strike overlay to verify that IV patterns hold across the strike range. Significant divergence at a single strike may indicate a concentrated position or unusual order flow.
- Track changes over time. Compare the term structure slope across multiple sessions. A steepening contango suggests the market is pricing in more long-term uncertainty. A shift from contango to backwardation signals a near-term event gaining significance.
- Pair with the Volatility Smile. The term structure tells you about the time dimension of IV; the smile tells you about the strike dimension. Together, they give you a complete view of the volatility surface.
Try it on Ainvest: Open the Volatility Term Structure — compare IV across expiration dates for any ticker.
