
What Is It
Options Rankings is a sortable leaderboard showing the most notable options contracts across the entire market. It helps traders discover which contracts are attracting the most activity -- whether measured by raw trading volume, outstanding open interest, or the ratio between the two.
Rather than searching ticker by ticker, Options Rankings gives you a top-down view of where the action is happening right now.
Where to Find It
- Web: Navigate to ainvest.com/options and scroll to the Options Rankings section at the bottom of the page.
- Mobile: Open the Market tab, tap Options, then scroll past Market Trend and Option News to reach the Options Ranking section.
Platform differences: The web version displays a full table with all columns and pagination (10 contracts per page). The mobile version shows a condensed card-style list with the symbol (including expiration and strike), Chg%, Volume, and a star icon to add the contract to your watchlist.
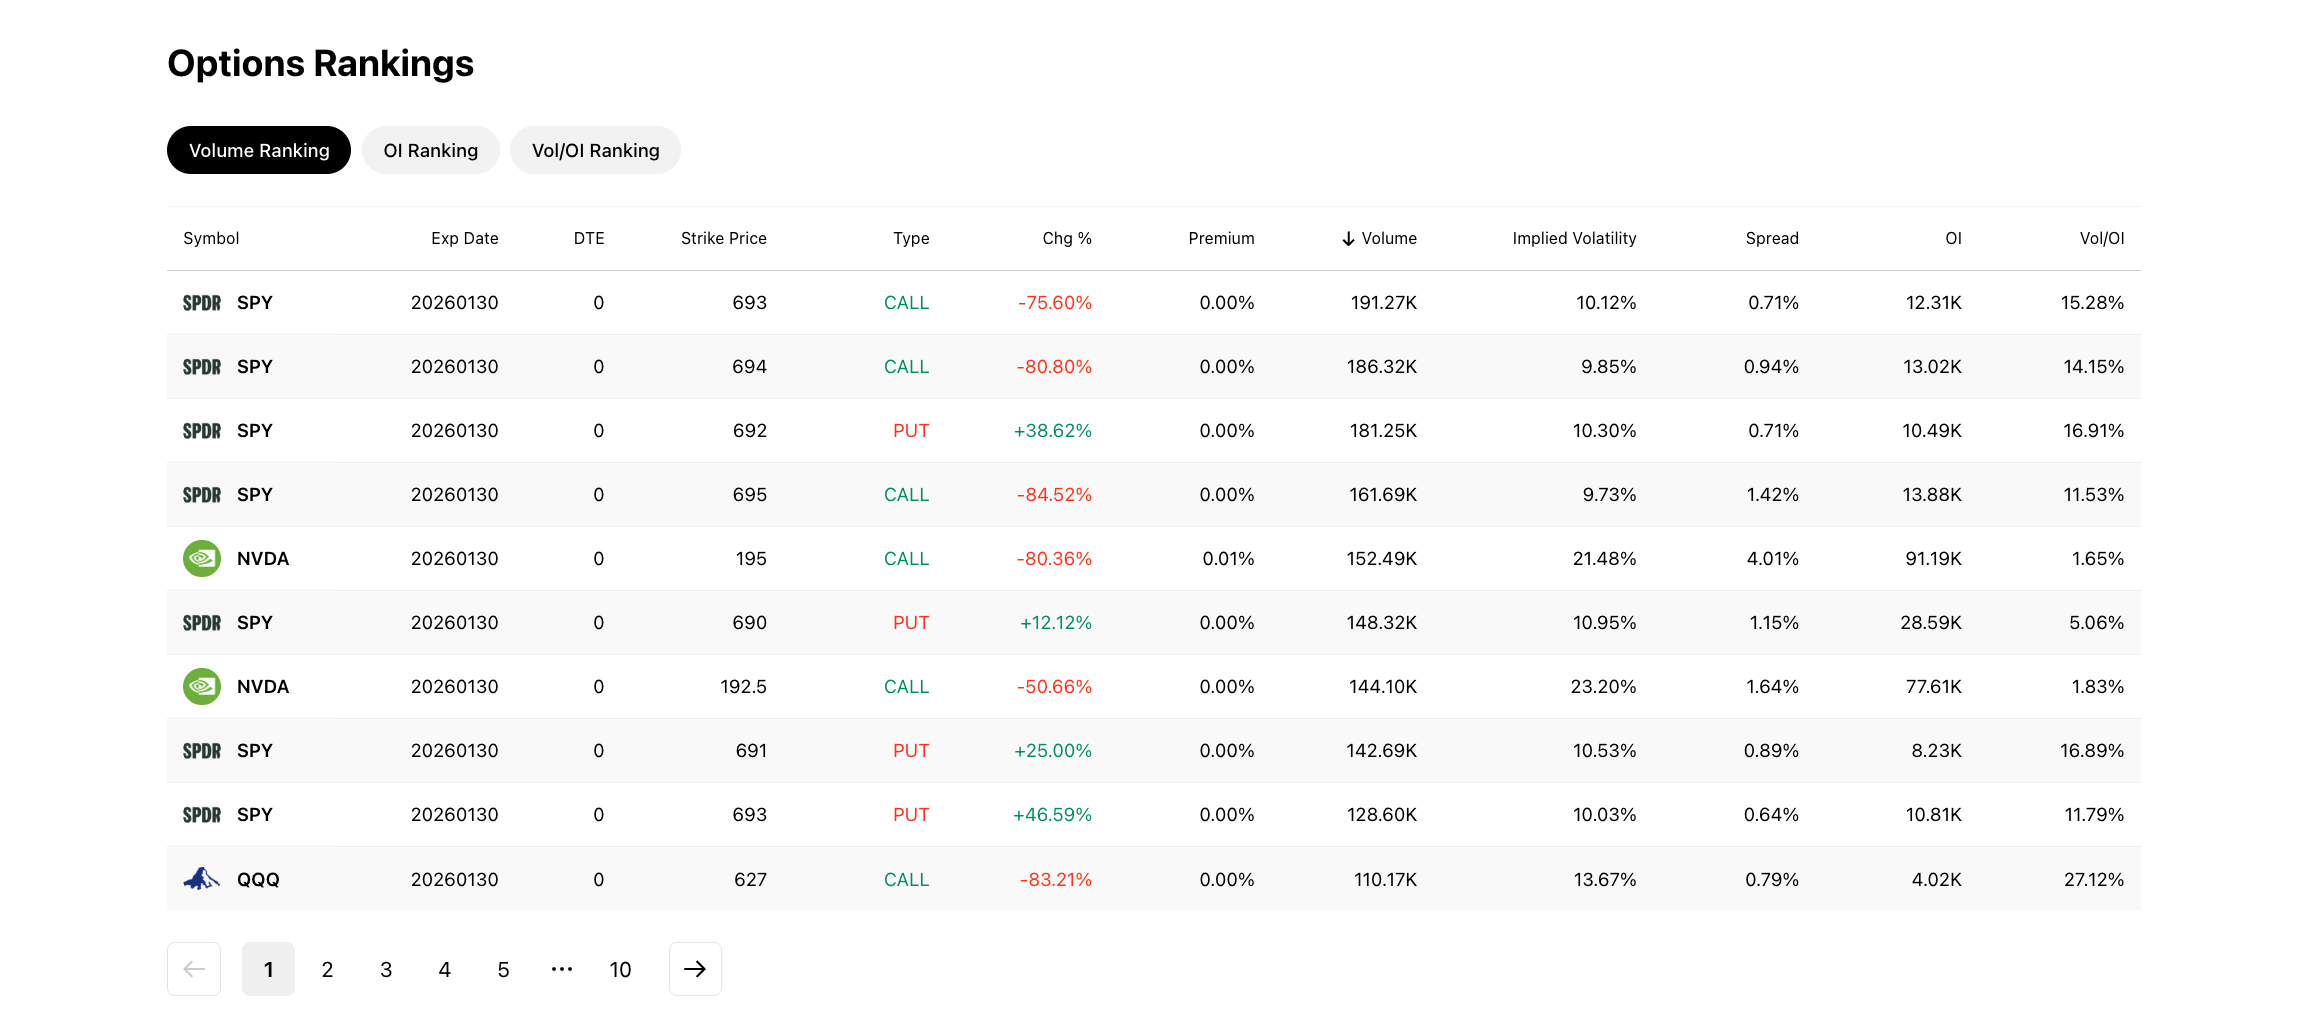
Web Options Rankings section showing Volume, OI, and Vol/OI tabs with a sortable table of top options contracts
How It Works
Options Rankings offers three ranking modes, available on both web and mobile:
Volume Ranking
Sorts contracts by the number of contracts traded in the current session. High volume indicates active interest in a particular contract. This is the simplest measure of market attention -- the more contracts changing hands, the more traders are focused on that strike and expiration.
OI Ranking (Open Interest)
Sorts by the total number of outstanding contracts that have not yet been closed or exercised. High open interest indicates established positions. These are contracts where traders have committed capital and are maintaining their bets, making them potential areas of support or resistance for the underlying stock.
Vol/OI Ranking
Sorts by the ratio of today's volume to open interest. This is often the most informative ranking mode. A high Vol/OI ratio (for example, above 1.0) means today's trading activity exceeds the total outstanding position -- a strong signal of unusual or new interest in that contract. A Vol/OI of 5.0 means today alone has seen five times more trading than the entire existing position.
How to Read the Data
Understanding the relationship between volume and open interest is the key to interpreting rankings effectively:
- High Volume + Low OI (high Vol/OI): New positions are being opened. This is fresh interest and potentially the strongest signal of unusual activity. Someone is initiating a new bet that did not previously exist at meaningful scale.
- High Volume + High OI (moderate Vol/OI): Active trading of established positions. This could indicate rolling (closing one expiration and opening another), adding to existing positions, or closing out. Context from the underlying stock's price action helps clarify which.
- Low Volume + High OI (low Vol/OI): Established positions that are not seeing much current activity. These are "quiet" positions -- worth noting as potential support/resistance levels, but not signaling new directional conviction.
- Spread: A spread above 5-10% suggests the contract is illiquid. You may face difficulty entering or exiting at a fair price. Wide spreads erode profits, so factor this cost into any trade decision.
- Implied Volatility: Compare IV across similar strikes and expirations. Unusually high IV on a specific contract may indicate that the market anticipates news or events that could move the underlying stock.
Practical Example
You open Options Rankings set to Vol/OI Ranking and notice "SPY PUT 20260130 690" with a Vol/OI of 44.71%. The volume is 313 contracts against an OI of just 7 -- meaning today's activity is roughly 44 times the outstanding position. This is an extremely unusual level of activity, suggesting new put positions are being opened at the $690 strike expiring today.
Combined with 37.66% implied volatility and a 37.62% spread, this contract is seeing aggressive speculative interest. The wide spread tells you that execution costs will be high, so this is more useful as an informational signal (bearish positioning on SPY) than as a contract you would necessarily want to trade directly.
Tips
- Start with Vol/OI Ranking to find unusual activity, then switch to Volume Ranking to see the most liquid contracts. This two-step approach helps you spot signals first and tradeable opportunities second.
- Use rankings as a starting point. Once you identify an interesting contract, drill into the ticker's Option Chain and Unusual Activity Monitor for deeper analysis of the full options landscape.
- Compare rankings across sessions. Early-session volume spikes (within the first 30-60 minutes of market open) can be particularly informative, as they often reflect overnight positioning decisions by institutional traders.
Try it on Ainvest: View Options Rankings — sort contracts by volume, open interest, and Vol/OI ratio.
