
This guide walks through every column and visual element in the Ainvest options chain so you can confidently interpret the data and make informed trading decisions.
Where to Find It
- Web: Navigate to
https://www.ainvest.com/options/{TICKER}/and select the Option Chain tab. For ETFs, usehttps://www.ainvest.com/etfs/{TICKER}/options/. - Mobile: Open the ticker page, tap the Options tab, then select the Chain sub-tab.
Web Layout
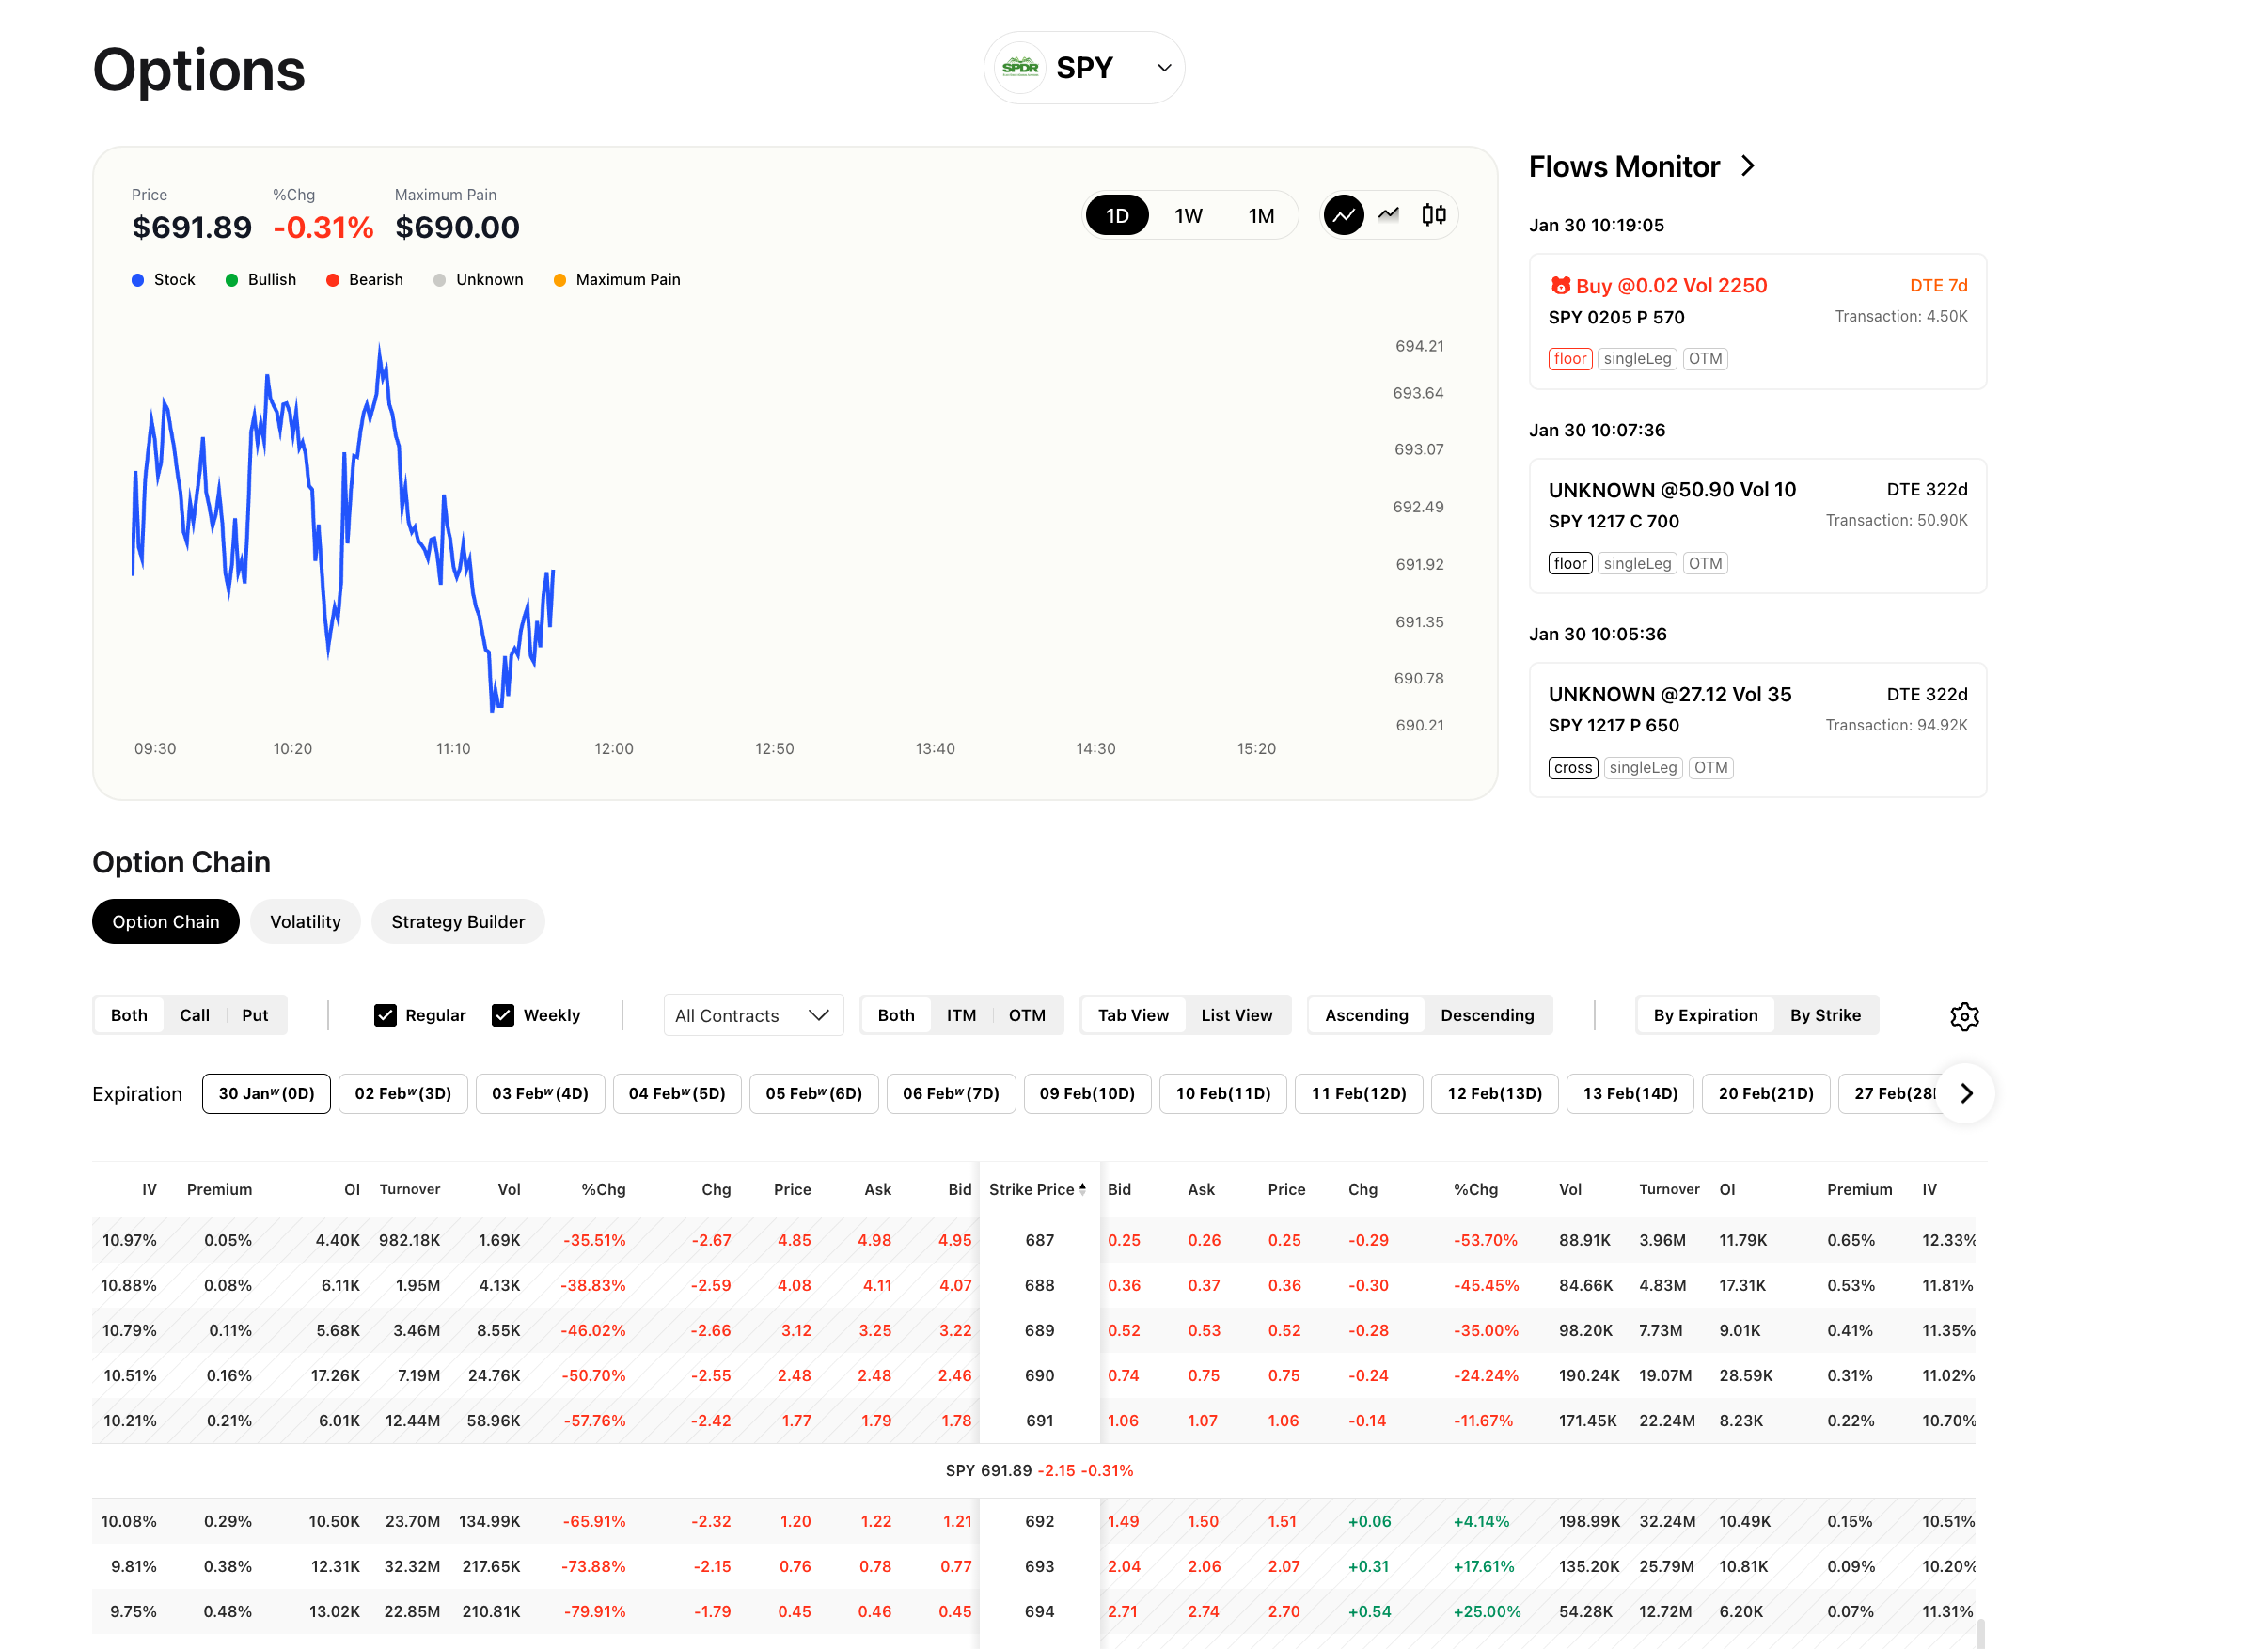
Web option chain showing the dual-panel layout with calls on the left, puts on the right, and columns for Premium, OI, Turnover, Vol, %Chg, Chg, Price, Ask, Bid, and Strike
On the web, the options chain uses a dual-panel layout:
- Left side: Call contracts
- Right side: Put contracts
- Center column: Strike price
The current price of the underlying asset is displayed as a reference line across the chain (for example, "SPY 691.89"). Contracts that are in the money (ITM) are visually distinguished from contracts that are out of the money (OTM), making it easy to see at a glance which contracts carry intrinsic value.
Mobile Layout
Mobile option chain view showing single-column layout with expiration date tabs and strike price rows
On mobile, the chain uses a single-column layout:
- An All / Call / Put toggle sits at the top of the screen, letting you choose which contract type to display.
- Expiration date tabs run across the top (for example, "30 Jan", "06 Feb", "13 Feb", "20 Feb"). Tap a tab to load the chain for that expiration.
- Each row shows the strike price, bid, ask, and last price.
The mobile layout is intentionally simpler. It presents the most essential pricing data without the full set of columns available on the web, keeping the interface fast and readable on smaller screens.
The mobile app also provides a strike price analysis view with visual charts showing ITM and OTM breakdowns:
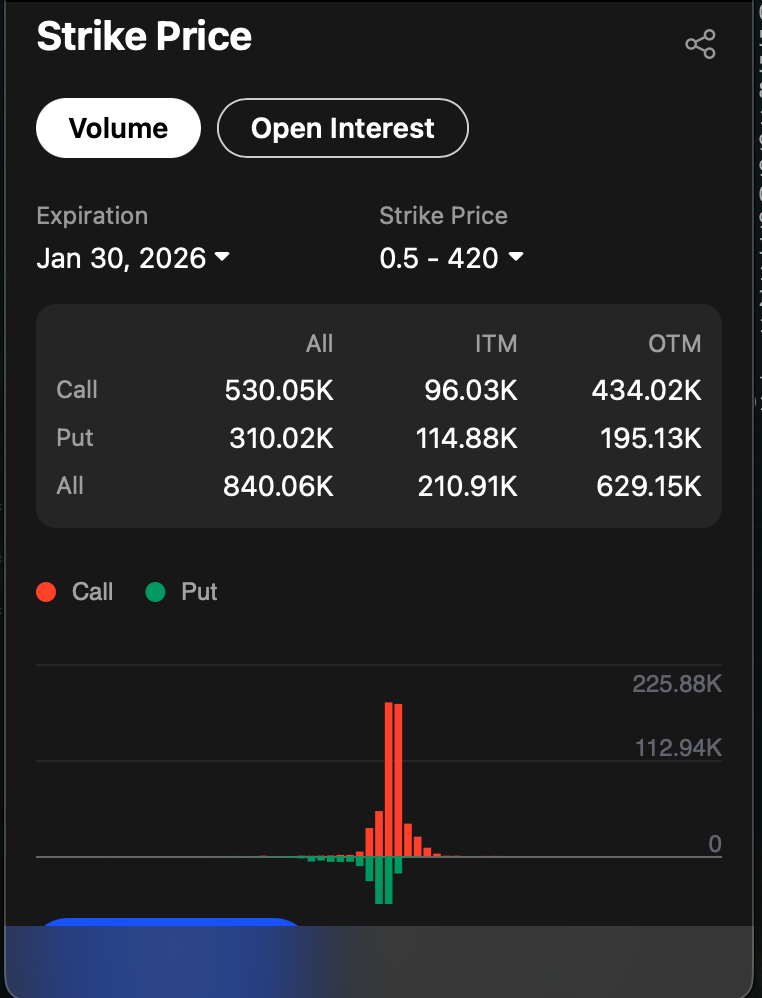
Mobile strike price analysis bar chart showing volume and open interest distribution across strikes
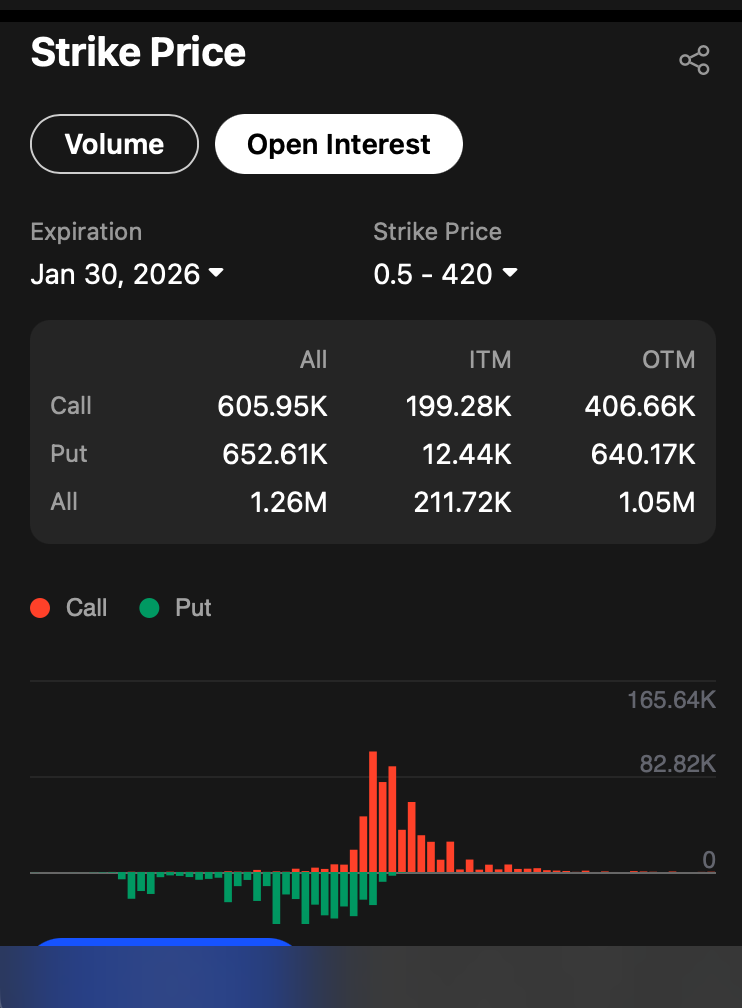
Mobile ITM and OTM breakdown showing contract classification relative to current price
Column Definitions
Premium
The premium is the market price of the option contract. It represents the cost a buyer pays and the income a seller receives. Premium is quoted on a per-share basis, so a premium of 3.50 on a standard contract (100 shares) means the total cost is $350.
Bid
The bid is the highest price a buyer is currently willing to pay for the contract. If you are selling an option, the bid is the price you can expect to receive in a market order.
Ask
The ask is the lowest price a seller is currently willing to accept. If you are buying an option, the ask is the price you will pay in a market order. The difference between bid and ask is called the spread and is a key indicator of liquidity -- tighter spreads generally mean more liquid contracts.
Price (Last Traded)
The last price at which the contract changed hands. This may differ from the current bid and ask, especially for contracts that do not trade frequently.
Chg (Change)
The absolute dollar change in the option's price compared to the previous session's close. A value of +0.45 means the contract's price has risen by $0.45 per share since yesterday's close.
%Chg (Percent Change)
The percentage change in the option's price from the previous close. This is useful for comparing movement across contracts with different price levels. A contract priced at 1.00 that moves +0.10 shows +10%, while a contract priced at 10.00 that moves +0.10 shows +1%.
Vol (Volume)
The number of contracts traded during the current session. High volume indicates active trading interest at that strike and expiration. Volume resets to zero at the start of each trading day.
OI (Open Interest)
The total number of outstanding contracts that have not been closed, exercised, or expired. Open interest updates once per day (after the close). A contract with high OI has an established position base, which typically supports tighter bid-ask spreads and easier order fills.
Turnover
The total dollar value of contracts traded during the session. Turnover is calculated as volume multiplied by the contract price multiplied by the contract multiplier (typically 100). It gives you a sense of the dollar flow into a particular strike.
Strike Price
The price at which the option holder has the right to buy (for calls) or sell (for puts) the underlying asset. Strikes are listed in the center column and increase from top to bottom (in ascending sort order). Strikes above the current underlying price are OTM for calls and ITM for puts; strikes below the current price are ITM for calls and OTM for puts.
Try it on Ainvest: Open the Option Chain — see every column described above with live data.
