
The Trade Ideas section highlights options contracts experiencing abnormal volume -- contracts where today's trading activity significantly exceeds normal levels. These automated alerts surface potential opportunities by identifying contracts that are attracting unusual interest from the market. It is one of the three content types available in Ainvest's Option Lab.
Where to Find Trade Ideas
- Web: Navigate to https://www.ainvest.com/options/ and scroll to the Option Lab section. Trade ideas appear within the broader content area.
- Mobile: Open the Market tab, then tap Options. Select the Trade Idea tab (the second tab, between Market and 0DTE). Trade ideas are presented as swipeable cards.
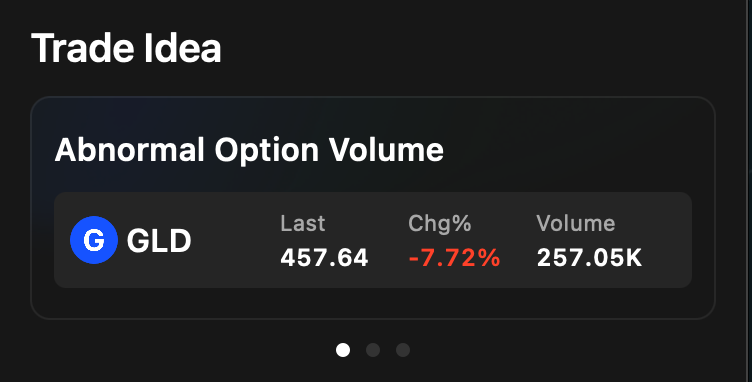
Mobile Trade Ideas tab showing abnormal option volume cards with ticker symbols, prices, and volume data
Platform differences: Mobile offers a dedicated tab with a focused card-based presentation, making it the primary experience for browsing trade ideas. The web version integrates trade ideas within the broader Option Lab content area.
How It Works
The mobile experience provides the most streamlined view of trade ideas.
- Header: "Trade Idea" with the sub-label "Abnormal Option Volume."
- Each card displays:
- Ticker symbol with icon (e.g., GLD with a blue "G" icon)
- Last price: most recent underlying price (e.g., 457.64)
- Chg%: price change percentage for the day (e.g., -7.72% displayed in red)
- Volume: total option volume for the ticker (e.g., 257.05K)
- Cards are arranged in a swipeable carousel with dot indicators showing how many ideas are available.
What "Abnormal Volume" Means
Ainvest's algorithm compares current-day option volume for a contract or ticker against its historical average. Contracts flagged as abnormal have volume that is significantly above the historical norm -- often 2x, 5x, or even 10x or more the average daily volume.
Abnormal volume can indicate several things:
- Institutional accumulation: large players building positions ahead of a catalyst.
- Pre-event positioning: traders buying options before earnings, economic data, or other scheduled events.
- Speculative bets: concentrated wagers on a particular outcome, often with short-dated contracts.
- Hedging activity: large holders protecting existing equity or options positions against downside risk.
Abnormal volume does NOT guarantee a profitable trade. It signals that something noteworthy is happening that warrants further investigation on your part.
How to Use Trade Ideas
- Scan the Trade Idea cards for tickers you recognize or want to investigate. Familiar names give you a head start because you already have context on the company and its recent price action.
- Note the Chg% value. A large negative change combined with high volume could indicate panic hedging through puts or bottom-fishing through calls. A flat price with surging volume may signal quiet accumulation before a move.
- Tap into the ticker to explore further. Check the Option Chain for specific contracts driving the volume, the Unusual Activity Monitor for trade-level details, and the Flows Monitor for the broader flow picture.
- Treat trade ideas as a screening tool, not as buy or sell signals. Always conduct your own analysis before entering any position. The alert tells you where to look; your research determines whether to act.
Practical Example
The Trade Ideas tab shows GLD (Gold ETF) with a -7.72% price change and 257.05K in option volume. This massive volume during a sharp price decline suggests heavy put activity or institutional hedging. Tapping into the GLD ticker page, you could check the Unusual Activity Monitor to determine whether the volume is dominated by put buying (bearish conviction) or put selling (bullish contrarians collecting premium on the decline). The distinction matters: both scenarios produce high volume, but they reflect opposite directional views.
Tips
- Check trade ideas during the first hour of trading and again in the last hour. These windows are when institutional activity is typically heaviest, and abnormal volume detected during these periods tends to carry more significance.
- Large volume on a ticker with minimal price movement can be more meaningful than large volume accompanying a large price swing. Quiet accumulation -- high options volume with a flat underlying -- may signal positioning before a breakout or breakdown.
- Combine trade ideas with the 0DTE Rankings to identify whether abnormal volume is concentrated in near-term or longer-dated contracts. Near-term concentration suggests traders expect an imminent move, while longer-dated concentration points to a more gradual thesis.
Disclaimer: All data and information presented are from third-party data sources. They are for reference only and do not constitute any investment advice.
Try it on Ainvest: View Trade Ideas — discover contracts with abnormal volume today.
