
What Is the Unusual Activity Monitor?
The Unusual Activity Monitor provides a per-ticker view of unusual options trading activity. Unlike the market-wide Block Monitor, which scans for large trades across all tickers, this tool focuses on a single underlying asset. It includes a Trading Summary that shows the overall call versus put volume balance and a chronological feed of individual transactions, giving you a complete picture of how options traders are positioning on the stock you are researching.
Where to Find It
- Web: On the Option Ticker Page (for example, www.ainvest.com/options/ARCA-SPY/), the Flows Monitor sidebar displays recent individual trades with details. This view is integrated into the ticker page alongside the option chain and other analysis tools rather than existing as a separate standalone page.
- Mobile: Navigate to any ticker page, tap the Options tab, then select the Unusual Monitor sub-tab. The mobile version is the more feature-rich experience for unusual activity, with a dedicated Trading Summary panel and a full chronological feed.
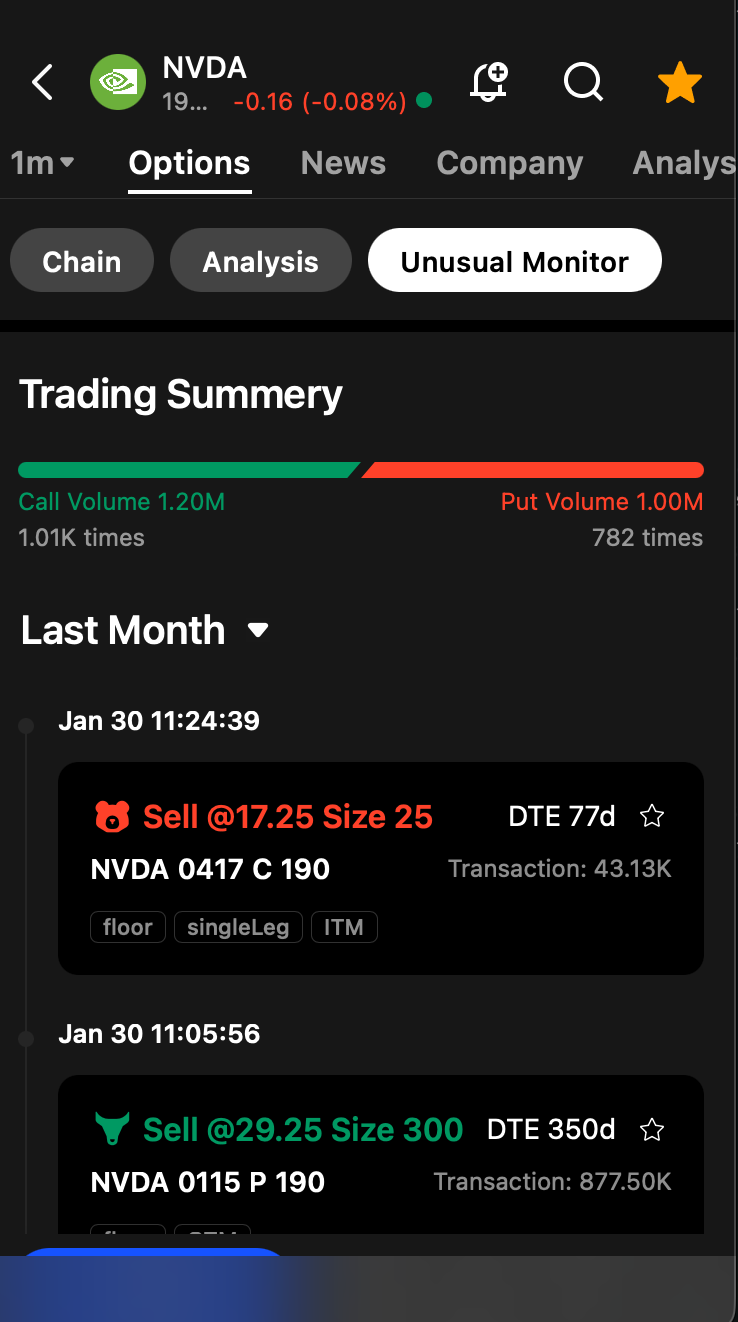
Mobile Unusual Monitor tab showing per-ticker unusual trades feed with Trading Summary panel
- Platform differences: The mobile version offers a more prominent and detailed unusual activity experience, including the Trading Summary panel at the top and a scrollable trade feed below. The web version presents the same data in a sidebar format alongside other tools on the ticker page.
How It Works (Mobile — Primary Experience)
Trading Summary Panel
At the top of the Unusual Monitor, a Trading Summary panel provides an at-a-glance sentiment read for the selected ticker:
- A visual bar showing Call Volume versus Put Volume, with proportional coloring (green for calls, red for puts). This bar makes it immediately clear which side of the market is more active.
- Total Call Volume and total Put Volume figures.
- The number of individual call transactions and put transactions.
For example: "Call Volume 1.20M (1.01K times) | Put Volume 1.00M (782 times)" tells you that call volume exceeds put volume and that there have been more individual call transactions as well, indicating broad-based bullish activity rather than a single large trade skewing the numbers.
Chronological Trade Feed
Below the summary, a scrollable feed lists each unusual trade in reverse chronological order. Every entry includes:
- Direction: A Buy (green) or Sell (red) indicator showing which side initiated the trade.
- Price: The execution price of the option contract (for example, "@17.25").
- Size: The number of contracts in the trade (for example, "Size 25").
- DTE: Days to expiration, displayed as a badge (for example, "DTE 77d")
- Contract: The full contract specification — ticker, expiration date, strike price, and call or put designation (for example, "NVDA 0417 C 190").
- Transaction value: The total dollar amount of the trade (for example, "Transaction: 43.13K").
- Tags: Classification labels such as floor, singleLeg, ITM, OTM, and others that provide context about how and where the trade was executed.
- Star icon: Tap to save the trade to your watchlist for later reference.
The feed includes a time-period dropdown filter. The default view is "Last Month," with other options available to narrow or expand the window.
How to Read the Data
Trading Summary as a Sentiment Gauge
The Trading Summary gives you a quick directional read. If call volume significantly exceeds put volume, traders are leaning bullish on this ticker. If put volume dominates, sentiment is bearish or heavily hedged. Also pay attention to the transaction count — if call volume is high but driven by just a few trades, it may reflect one institution rather than broad consensus. High volume spread across many transactions suggests wider participation.
Spotting Clusters
Look for clusters of large trades in the same direction within a short time window. Multiple large call buys appearing over the course of an hour suggest coordinated or convergent institutional interest. A single large trade could be a hedge or a one-off event, but a cluster is a stronger signal.
Comparing to Market-Wide Flow
Use the Unusual Activity Monitor alongside the Flows Monitor Chart to determine whether the unusual activity on your selected ticker aligns with or diverges from broader market sentiment. A ticker showing strong bullish unusual activity while the overall market flow is bearish could indicate company-specific conviction — perhaps ahead of earnings or a product announcement.
Reading the Tags
Tags help you classify each trade. Trades tagged floor were executed on the exchange floor, which often points to institutional origin. The singleLeg tag confirms a directional bet rather than part of a multi-leg spread. ITM and OTM tags tell you whether the option had intrinsic value at the time of execution, which helps distinguish between speculative bets (OTM) and hedging or position management (ITM).
Practical Example
You open the Unusual Activity Monitor for NVDA. The Trading Summary shows 1.20M call volume versus 1.00M put volume across the day, with calls accounting for 1,010 transactions compared to 782 for puts. The call-heavy balance suggests a bullish tilt.
Scrolling through the feed, you notice three Sell orders for NVDA puts in the $190 strike range within the last hour. Each has a DTE of 77 days and a transaction value above $40,000. Selling puts is a bullish signal — the seller collects premium and is obligated to buy NVDA at $190 if the stock falls to that level, meaning they are comfortable owning shares at that price and expect it to stay above.
Combined with the call-heavy volume ratio in the Trading Summary, this pattern suggests strong bullish sentiment among institutional traders on NVDA. You might use this information alongside your own technical and fundamental analysis to inform a trading decision, or cross-reference it with the Flows Monitor Chart to see if the bullish flow has been building over multiple days.
Tips for Using the Unusual Activity Monitor
- Pair with the Option Chain. Check whether unusual trades are occurring at strikes with high existing open interest. A large trade at a strike with already-elevated open interest may be adding to an existing institutional position, which strengthens the signal.
- Use the time filter. The "Last Month" default gives you a broad view, but switching to a shorter window helps you focus on the most recent activity. If unusual trades are appearing today but were absent last week, something new may be driving the positioning.
- Compare the Trading Summary ratio. Cross-reference the call/put ratio from the Trading Summary with the Put/Call Ratio shown on the Market Trend cards in the Flows Monitor. If your ticker's ratio diverges sharply from the market average, it is exhibiting unusual sentiment relative to the broader market.
Try it on Ainvest: View unusual options activity — monitor per-ticker unusual trades and institutional flow.
