
What Is the Block Monitor?
The Block Monitor is a real-time feed of large options block trades detected across the entire market. Block trades are high-volume transactions typically executed by institutional investors — hedge funds, pension funds, proprietary trading firms, and other large market participants. Because these trades involve significant capital, they can signal directional conviction, hedging activity, or strategic repositioning that may precede meaningful price movement in the underlying asset.
Unlike the Flows Monitor Chart, which shows aggregate volume, the Block Monitor displays individual trades. This gives you granular visibility into exactly who is buying or selling, at what price, in what size, and for which contract.
Where to Find It
Web: Navigate to https://www.ainvest.com/block-monitor/. This is a dedicated full-page tool with comprehensive filtering capabilities.
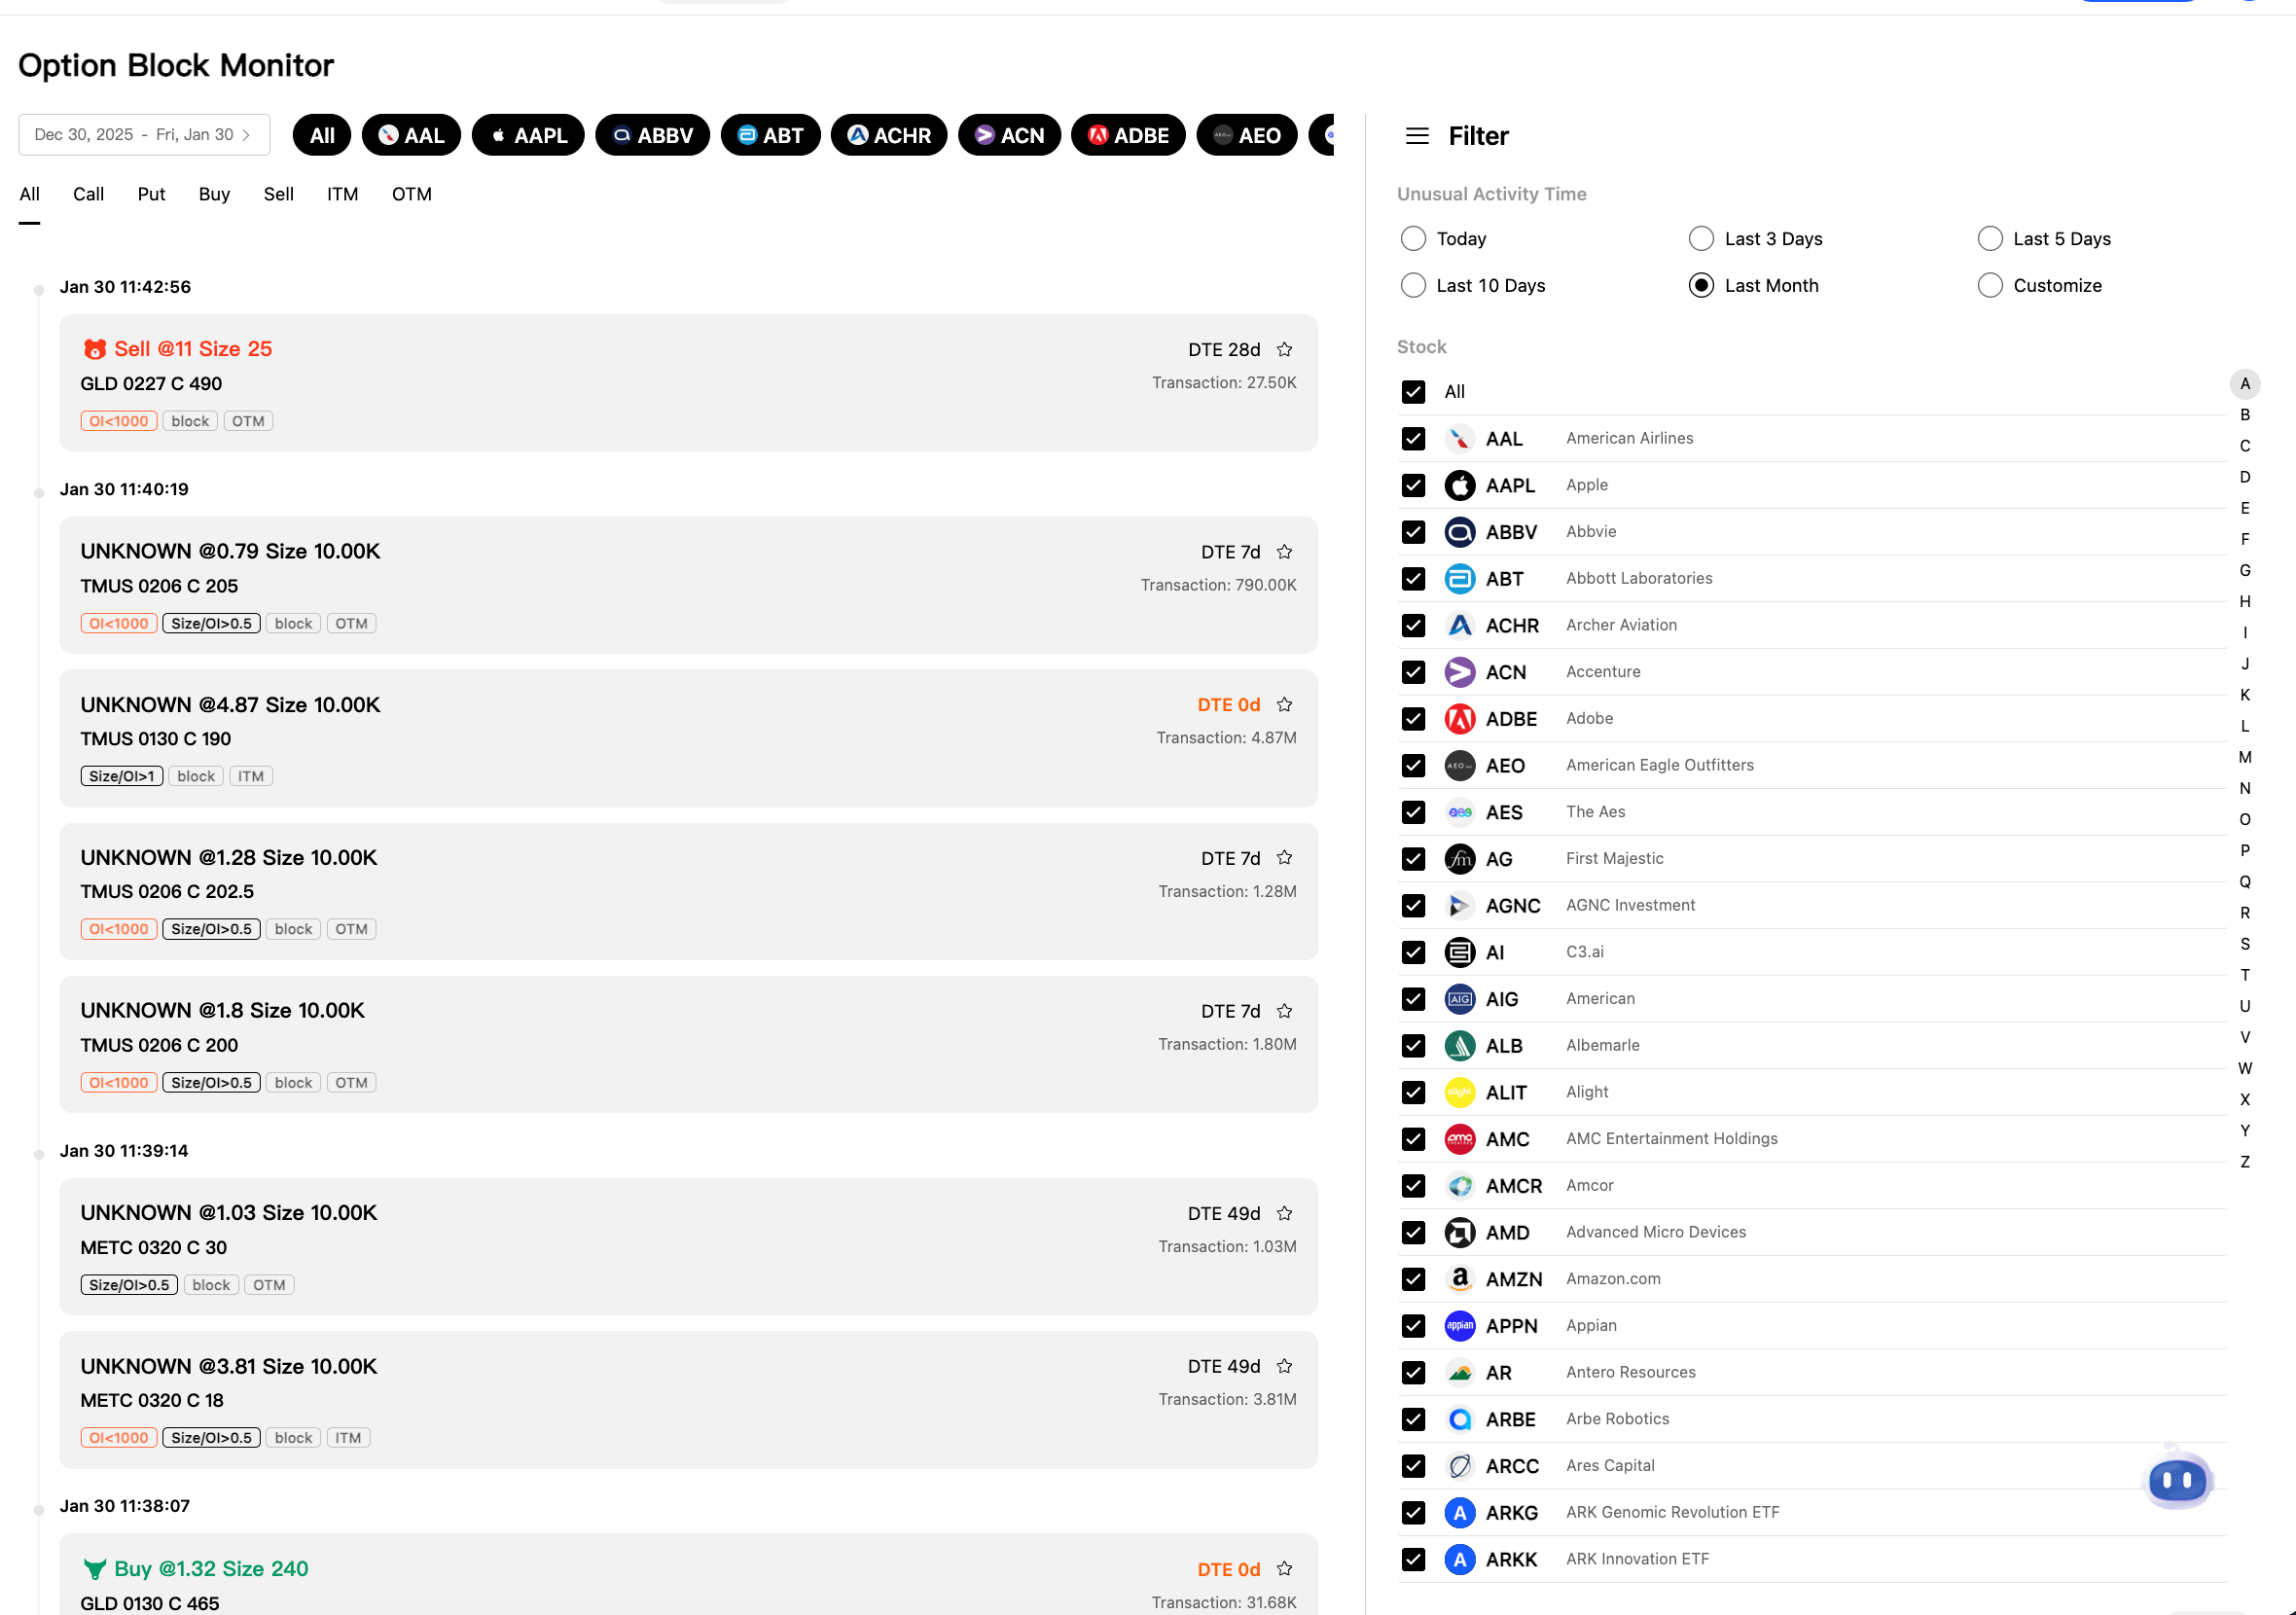
Web Block Monitor page showing full filters including date range, ticker, ITM/OTM toggles, and block trade entries with tags
Mobile: Open the Market tab, then tap Options and scroll to the Block Flows section. The mobile version shows a simplified list with Symbol, Volume, and Turnover columns.
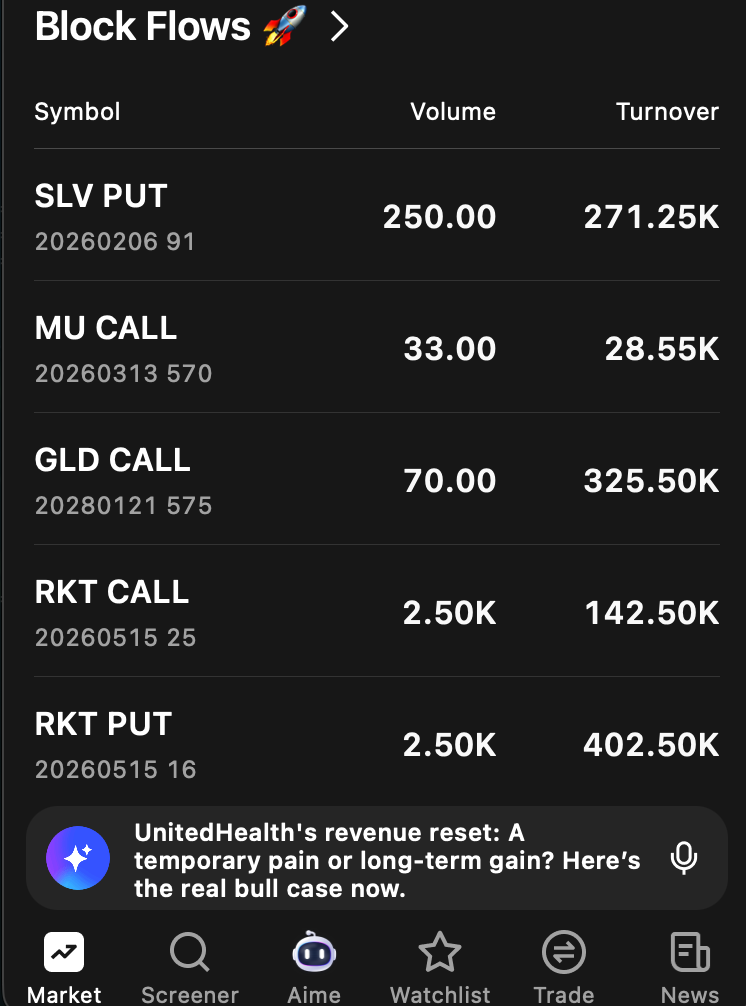
Mobile Block Flows list showing simplified view with Symbol, Volume, and Turnover columns
Platform differences: The web version offers the full filtering suite, including date range, multi-ticker selection, trade type, moneyness, and time range filters. The mobile Block Flows view is a condensed feed showing the most notable recent block trades without advanced filters.
How It Works (Web)
Trade Feed
The main area of the page displays a chronological feed of block trades, with the most recent trades at the top. Each entry contains the following information:
- Timestamp: The exact time the trade was detected (for example, "Jan 30 11:42:56").
- Direction indicator: A colored badge indicates whether the trade was a Buy (green) or Sell (red).
- Trade details: The execution price and the number of contracts — displayed as "Price @ [amount], Size [number of contracts]."
- Contract info: The ticker symbol, expiration date in MMDD format, call or put designation, and strike price (for example, "GLD 0227 C 490" means a GLD call option with a $490 strike expiring February 27).
- DTE badge: The number of days to expiration, color-coded for quick reference. Green indicates near-term expiration, and "DTE 0d" marks zero-DTE contracts.
- Transaction value: The total dollar value of the trade (for example, "Transaction: 27.50K"). This is calculated as the execution price multiplied by the number of contracts multiplied by 100 (since each contract represents 100 shares).
- Tags: Classification labels that provide additional context about the trade:
singleLeg— A straightforward single-leg trade, not part of a multi-leg spread.ITM— The option is in the money at the time of execution.OTM— The option is out of the money.floor— The trade was executed on the exchange floor, which often indicates institutional origin.simpEx0.5— A simplified exchange indicator.
Filters
The web version provides a robust set of filters to help you narrow the feed to the trades that matter most:
- Date range: Select start and end dates to define the time window (for example, "Dec 30, 2025 -- Fri, Jan 30").
- Stock ticker filter: A multi-select dropdown with search functionality. Selected tickers appear as colored badges at the top of the filter area, making it easy to see your active filters at a glance (for example, AAL, AAPL, ABBV, ABT).
- Type filters: Toggle buttons for All, Call, Put, Buy, Sell, ITM, and OTM. These can be combined — for instance, selecting "Call" and "Buy" shows only call purchases.
- Unusual Activity Time: Preset time windows including Today, Last 3 Days, Last 5 Days, Last 10 Days, Last Month, or a custom date range.
How It Works (Mobile — Block Flows)
The mobile experience presents a simplified list format optimized for quick scanning. Each row shows:
- The ticker symbol with a Call or Put label
- Expiration date and strike price
- Volume (number of contracts)
- Turnover (total dollar value of the trade)
For example: "SLV PUT 20260206 91 -- Volume: 250.00 -- Turnover: 271.25K"
The mobile view does not include advanced filters. It automatically surfaces the most notable recent block trades based on size and recency.
How to Read the Data
Size Matters
Not all block trades carry the same weight. A block of 50 contracts is noteworthy, but a block of 2,000 contracts on the same strike is a far stronger signal. Focus your attention on the largest trades, especially those with transaction values in the hundreds of thousands or millions of dollars.
Buy vs. Sell Direction
- Buying calls is a bullish signal. The buyer profits if the underlying stock rises above the strike price.
- Buying puts is a bearish signal or a hedge. The buyer profits if the stock falls below the strike price.
- Selling calls is more nuanced. It can be bearish (the seller expects the stock to stay flat or decline) or income-generating (covered calls against an existing stock position).
- Selling puts is generally a bullish signal. The seller collects premium and is obligated to buy the stock if it falls below the strike — implying they are comfortable owning it at that price.
Days to Expiration (DTE) Context
- Near-term blocks (0-7 DTE) suggest conviction about imminent price movement. The trader is paying for time value that will decay rapidly, which means they expect the move to happen soon.
- Medium-term blocks (8-30 DTE) balance conviction with flexibility and are common around earnings dates and other scheduled catalysts.
- Long-dated blocks (30+ DTE) may represent strategic positioning, portfolio hedging, or accumulation. These trades give the thesis more time to play out.
ITM vs. OTM
- ITM blocks often indicate hedging, rolling existing positions, or adding to a position with less risk (since the option already has intrinsic value).
- OTM blocks are more speculative. The buyer is paying entirely for time value and extrinsic premium, betting on a move that has not yet occurred.
Transaction Value
The dollar amount attached to a block trade reveals the conviction level behind it. A $50,000 transaction is a meaningful position for a retail trader but routine for an institution. Transactions above $500,000 or $1,000,000 represent substantial capital commitments that are worth monitoring closely.
Practical Example
You open the Block Monitor and notice a Buy block for "AAPL 0221 C 250" with Size 500, Transaction $2.1M, DTE 22d, tagged singleLeg and OTM.
Here is what this tells you:
- Someone purchased 500 call contracts on Apple with a $250 strike price, expiring in 22 days.
- The trade is out of the money, meaning AAPL is currently trading below $250. The buyer needs the stock to rise above $250 (plus the premium paid) to profit.
- At $2.1 million, this is a significant capital commitment on a single directional bet.
- The
singleLegtag confirms this is a straightforward call purchase, not part of a spread or complex strategy.
With 22 days to expiration, the trader expects the move to happen within roughly three weeks.
This is an aggressive bullish bet worth investigating further. You might check the Unusual Activity Monitor on AAPL's ticker page to see if other traders are making similar bets, or open the Flows Monitor Chart to see whether aggregate call volume on AAPL has been trending higher.
Tips for Using the Block Monitor
- Use the ticker filter to focus on stocks already on your watchlist. This reduces noise and keeps your attention on the names you know best.
- Compare block activity with the Flows Monitor Chart for the same ticker. If a large block trade appears in isolation but aggregate flow is quiet, the trade may be a hedge rather than a directional bet. If the block aligns with a broader flow trend, the signal is stronger.
- Watch for clusters. A single block trade could mean anything — a hedge, a roll, a one-off bet. But multiple blocks in the same direction on the same ticker within a short window amplify the signal significantly. Three separate institutions buying calls on the same stock within an hour is more meaningful than one.
- Check the DTE. If you see a surge in near-term blocks (0-7 DTE) on a specific ticker, there may be a catalyst approaching — earnings, an FDA decision, a scheduled economic report, or another event that the options market is pricing in.
Try it on Ainvest: Open the Block Monitor — scan market-wide block trades with advanced filters.
