
📊 Ainvest Option Flow Digest — 2026-07-31
Thirteen blocks, ≈$324M net, and not a single sweep — including a ≈$32M crash hedge on the S&P 500 that the feed read backwards
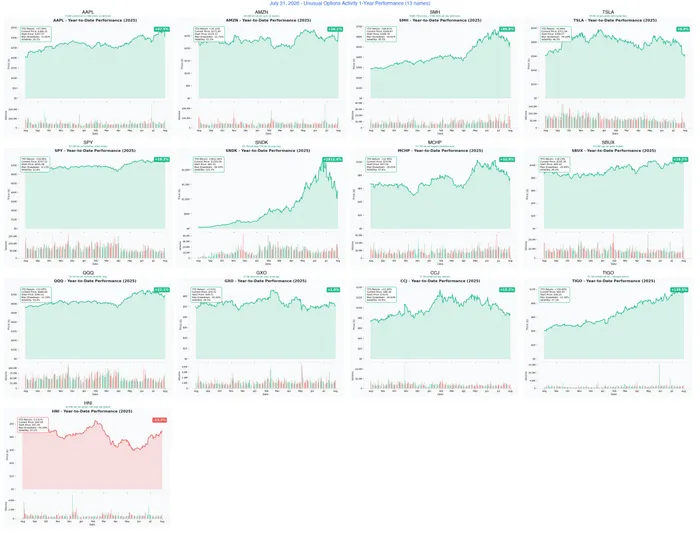
🎯 Quick Read
If you remember one thing today: every trade on this board was negotiated — a cross, an auction, or a floor block. There was not one lit sweep. Nobody chased anything. Thirteen desks quietly restructured, financed, or hedged.
- ≈$324M net across 13 names. But ≈$131M of that carries zero directional content — it is delta-one financing, not opinion. Strip it out and the genuinely position-taking flow is ≈$193M.
- ⭐ The most important trade of the day is SPY, and the feed had it backwards. It showed four put sales worth $114M. The tape shows six legs forming two put butterflies — the trader is paying ≈$31.8M, not collecting. In return they get up to ≈$3.0B if the S&P 500 lands near 535 by September 30 or 525 by October 16. That is crash insurance, bought.
- The single biggest ticket is also the emptiest. AAPL printed a "$124M call sale" on the day Apple fell ≈9.5%. It is a conversion: short call, long put at the same strike, plus 3,000,000 shares bought in the same second. The synthetic short priced at $301.21; the stock was bought at $301.22. A one-cent spread on ≈$904M. There is no view in it.
- GXO is the same trick in miniature — a deep-ITM call sold with $0.17 of time value against 700,000 shares in the same second. Also not bearish. Also no signal.
- QQQ looked like a $17M LEAP call buy. The tape shows a second leg — an $11.4M put sale that funds most of it. Real money committed: $5.55M.
- Semis got hedged from both sides. SMH saw two separate defensive trades three hours apart: a $51.7M in-the-money put bought for June 2027, and a $19.0M June-2028 call sold — both on strikes that barely existed before today. Worth noting: they went on into a two-day bounce, not a collapse. Chips V-bottomed on July 29–30.
- Two big rolls, not two new bets. AMZN cashed deep-ITM September calls on Amazon's best day in 11 years and redeployed into 2.5× the contracts, $20 higher. SNDK — up ≈353% year to date — rolled an expiring deep-ITM call out one week, moving it past SanDisk's confirmed August 5 earnings.
- Exactly two trades all day were unhedged and outright — and both were small. CCJ: a $1.69M put on a strike whose open interest was zero. And TIGO: a $1.75M call buy where the market was $2.10 bid / $3.50 offered and they paid the full offer — the closest thing to urgency on the whole board.
Before you copy any of this: seven of thirteen packages printed alongside a stock block that cancelled their delta, and four showed up in the feed with the wrong number of legs (SPY, QQQ, HNI and SNDK). Read the structure, not the headline.
🔁 OI Review — Last Session's Provisional Flags, Now Resolved
The July 31 pre-market open-interest snapshot is in, and Thursday's tape was the cleanest run in weeks — with one catch nobody would have found without it. Ten tickers carried ⏳ provisional flags across 16 legs. All 16 resolved: 14 opened, 2 closed, and not a single directional read inverted. But the check did something it usually doesn't — it caught an error of size, not direction: an exchange cancellation shrank SMH's call ticket by 25%, taking Thursday's gross from ≈$298M to ≈$293.6M.
🔄 The Correction — SMH was ≈$44M, not $49M
⚪ SMH — a cancelled clip took 2,000 contracts and ≈$4.4M off the headline.
Leg | Baseline OI | Resolving OI | Δ | Verdict | |
|---|---|---|---|---|---|
Aug-21-2026 $550 CALL | 1,867 | 10,006 | +8,139 | 8,000
(corrected from 10,000) | ✅
OPEN (STO) |
Jan-21-2028 $500 PUT | 185 | 3,139 | +2,954 | 3,000 | ✅
OPEN (STO) |
One of the two 5,000-lot call clips was cancelled by the exchange and re-reported at 2,000 roughly two minutes later. The genuine call sale is 8,000 contracts for ≈$17.6M, not 10,000 for $22M — taking that program from $49M to ≈$44M. The tell: open interest built +8,139, ≈102% of the corrected 8,000 but only ≈81% of the originally-published 10,000. Nothing in the intraday pipeline flagged this — only the OI-versus-size mismatch did.
🔄 The Read That Changed — EWY was NOT a roll
🛡️ EWY — OI 4,553 → 11,768 (+7,215). We published a real asterisk: the multi-day OI trend had been slipping, and the print was a negotiated cross with no readable aggressor, so a roll of an existing Korea hedge was equally plausible. Open interest more than doubled — ≈96% of the print created new contracts. This is brand-new insurance, not recycled.
✅ Confirmations
- 🐂 MSFT — the flagship flag, now proven. OI 10,736 → 21,511 (+10,775) against a 9,953-lot print. We said plainly that flat-or-falling OI would flip the bullish story. It doubled, and the build exceeded our buyer's own print — other desks opened alongside.
- ⚪ LRCX — the $45M put was an EXIT, confirmed to within 0.8%. OI 16,783 → 9,344 (−7,439) against a 7,500-lot print. Nobody put on $45M of new bearish risk — somebody retired an old hedge.
- ⚪ AMGN — roll confirmed on both sides. August $310 fell −1,726; October $310 rose +2,194. Opposite moves on the same strike are the signature of a roll.
- ⚪ QQQ — all four legs opened. The Sep-2026 $710 call sale rose +10,968. ⚠️ One asterisk: the Jun-2027 $600 put built only ≈41% new contracts, so ≈59% was existing holders transferring.
- 🐂 FLY 143 → 5,762, ≈164% of the print · 🔵 AVTR 138 → 23,190, matched to 0.3% · 🛡️ CORZ 3,105 → 8,163, a full open · ⚪ EQIX near leg a genuine fresh buy (3,181 → 6,022), far leg matched exactly (1 → 2,501).
The standing lesson, with a new wrinkle: a big headline is provisional until next-day open interest confirms it — and it can be wrong in size as well as in direction. Open interest is the only record that cannot be spun.
📋 At a Glance
Ticker | Net Premium | Expiration | Bucket | Catalyst in window? | Option Play | What It Means |
|---|---|---|---|---|---|---|
🦋
| $31.80M
debit | Sep-30-26 / Oct-16-26 | Monthly / Monthly | ✅ Sept FOMC + NVDA Aug 26 in both; Q3 earnings in Oct only | Two long put butterflies
(1×2×1) | Crash insurance bought
— ≈$32M for up to ≈$3.0B, but only near 535/525 |
🧊
| $123.63M
credit | Jul-31-2026 (same day) | 0DTE | Earnings already passed (Jul 30) | Conversion
vs 3,000,000 shares | No direction at all
— pure financing. Ignore the headline |
🔄
| $49.00M
debit | Sep-18-26 → Nov-20-26 | Monthly → Monthly | ✅ Q3 ≈Oct 22 in the
Nov
leg only | Long call
roll , up & out | Bullish
— an existing winner extended, not fresh conviction |
🛡️
| $51.67M
debit +
$18.96M
credit (net $32.72M) | Jun-17-27 / Jun-16-28 | LEAP
/
LEAP | Spans many quarters — not an event bet | ITM
put buy
+ 2028
call sale
(2 separate trades) | Defensive on chips
— buy downside, sell away upside |
🔄
| $30.98M
debit | Jul-31-26 → Aug-07-26 | Weekly | ✅
Earnings Aug 5 (confirmed)
— rolled from an expiry that died
before
it into one that survives
through
it | Deep-ITM call
roll , out & down | Stay long into the print
— deliberate, not housekeeping |
🐂
| $15.73M
debit | Sep-18-26 / Dec-18-26 | Monthly / Quarterly | ✅ Earnings ≈Aug 6 in
both ; Nov print in Dec only | Long call
diagonal | Bullish + income
— upside capped at $85 until September |
🪜
| $11.96M
debit | Jan-15-2027 | Quarterly+ | ✅ Q4 ≈Oct 29 — the
only
one inside | Long call
ladder
(both bought) | Bullish
— all $12M at risk, no cushion |
🛡️
| $9.17M
debit | Dec-15-2028 | LEAP
(≈2.4 yr) | Indifferent to any single quarter | Put-spread
collar
(4 legs) | Protection
— ≈$85M of downside, delta-neutral at inception |
🧊
| $7.47M
credit | Aug-21-2026 | Monthly (3 wk) | ✅ Earnings
Aug 4
(confirmed) — trade doesn't care | Delta-one call
cross
vs 700,000 shares | Non-directional
— pure financing. No signal |
🧩
| $5.55M
debit | Jan-21-2028 | LEAP
(≈18 mo) | Macro-driven; real risk window H2 2027 | Long
risk reversal | Bullish
— financed by an obligation to buy below $600 |
🪑
| $2.50M
debit | Sep-18-2026 | Monthly (7 wk) | ❌
None
— Q2 already reported Jul 30; Q3 ≈late Oct is
after
expiry | Bull call spread
40/50 | Bullish, defined risk
— both legs brand new, needs +12.5% for max |
📞
| $1.75M
debit | Aug-21-2026 | Monthly (3 wk) | ✅
Q2 earnings Aug 6 (company-confirmed)
sits
inside
it | Outright long
call , unhedged | Bullish
— paid the full offer, pressing a stock up ≈69% YTD |
☢️
| $1.69M
debit | Sep-11-2026 | Weekly
(≈6 wk) | ❌
None
— earnings Oct 30, 49 days
after
expiry | Outright long
put | Bearish
— the only unhedged bet today |
Net vs gross, and why it matters twice today. The ≈$324M headline is net — long premiums paid minus short premiums collected. On top of that, ≈$131M of it (AAPL + GXO) is delta-one financing with no directional content whatsoever. Genuine position-taking flow: ≈$193M.
🔍 The Three Worth Your Time
🦋 SPY — ≈$32M of crash insurance, and the feed showed it upside-down
Two floor-negotiated packages, 26 minutes apart, with the S&P 500 ETF near $746. The feed reported four legs, all sales, ≈$114M collected. The tape shows six legs — and a completely different trade.
September 30: buy 150,000 of the $635 put, sell 300,000 of the $535 put, buy 150,000 of the $435 put. October 16: buy 150,000 of the $625 put, sell 300,000 of the $525 put, buy 150,000 of the $425 put.
That 1 × 2 × 1 ratio is the signature of a butterfly. Net cost: $0.99 and $1.13 per share — ≈$31.8M in total, paid, not collected. Maximum value if the index settles right at a body strike: $100 per share, or ≈$1.5B per package.
Why we read it as bought rather than sold: every leg printed at the bid, but on a floor combo the exchange spreads one net price across the legs, so per-leg side flags mean little. The economics decide it. Selling this structure means risking ≈$1.485B to collect $14.85M — about 100:1 against you. Nobody does that. Paying ≈$32M for deep crash convexity is a standard pension and tail-fund hedge.
Now the honest part, because the payoff ratio is seductive. The body strikes sit at 535 and 525 — roughly 28–30% below spot. A butterfly pays best if the index lands near those strikes at expiry. A crash straight through 435/425 pays very little. No crash at all and the entire $31.8M is gone. This is insurance with a narrow strike zone and a hard deadline — not a forecast, and not something to copy.
All six legs are proven fresh opens: 150,000 and 300,000 contracts against prior open interest of just 425 to 5,778.
One more piece of context that matters: the S&P 500 itself barely flinched in July. While the Nasdaq-100 fell ≈10% and semiconductors ≈29% peak-to-trough, SPY's own drawdown was only ≈3.4%, and it sits under 2% below its high. This insurance was bought when the index was calm and the strikes were cheap — which is when insurance is supposed to be bought, and is the opposite of panic. Full breakdown →
🧊 AAPL — ≈$904M that means absolutely nothing
A desk sold 30,000 Apple $260 calls expiring today for $41.22 while the stock sat near $301.20. On its own that reads as a $124M bearish bet on a day Apple dropped ≈9.5%.
It isn't. Two other things printed in the same breath:
- They bought 30,000 of the same-strike $260 puts for one cent.
- 3,000,000 shares crossed at $301.22 in the same second.
Short call + long put at one strike = a synthetic short at 260 + (41.22 − 0.01) = $301.21. They bought the stock at $301.22. That is a one-cent spread on ≈$904 million of notional.
Walk it to this afternoon's expiry: the $260 call gets assigned, they hand over the 3,000,000 shares just bought, collect $260 a share, and keep the $41.22 — $301.22 total, exactly what they paid. Flat by construction. The penny put is insurance for the few hours in between.
This is a conversion — a financing and stock-loan trade. Desks do them for carry, never for a view. Learn the shape: deep-ITM short call + same-strike long put + a same-second stock block = no opinion whatsoever. Full breakdown →
🛡️ SMH — the one place somebody actually changed their mind
Two separate crosses, three hours apart, both leaning the same way on semiconductors:
- 10:38 — sold 2,000 June-2028 $730 calls for $19.0M. Prior open interest on that strike: 3 contracts.
- 13:45 — bought 3,900 June-2027 $625 puts for $51.7M. Prior open interest: 49. A 195,000-share block printed 1.5 seconds later, almost exactly matching the position's delta.
Both are proven fresh opens on strikes that barely existed. Together: buy downside, sell away upside, out to 2027 and 2028.
The context is a sector already in a drawdown — the SOX index down ≈24%, more than $1T of chip value erased, and the Nasdaq-100 entering a ≈10% correction on July 29. And note the shift: yesterday the largest SMH ticket was somebody selling volatility. Today somebody is paying up for protection — an in-the-money put with ≈$54 of time value in it is an expensive hedge, which says something about conviction on timing.
The honest limit: each trade was delta-hedged with stock, so the dealer is flat and the customer carries the negative delta. Whether that customer is protecting a semiconductor book they already own or pressing a bearish view, the tape cannot tell us. Full breakdown →
☢️ CCJ and 📞 TIGO — the only two unhedged bets on the board
15,085 September $74 puts at $1.12, bought at 09:49. Prior open interest: 0. The contract did not exist before this morning — the cleanest open/close read of the entire day.
It has one companion. TIGO (Millicom, the Latin American telecom, ≈$95) saw 5,000 August $100 calls bought for $1.75M against prior open interest of just 96 — and Millicom has confirmed its Q2 report for August 6, which lands inside that expiry — so this is squarely an earnings-window bet. The detail worth noting: the market was $2.10 bid, $3.50 offered — and they paid the full $3.50. On a $1.40-wide market that is real urgency, and it is the only urgency anywhere today. The catch is that the stock is already up ≈69% year to date, so this is pressing a winner rather than catching a falling knife. Its option chain is also thin enough that a retail trader would give up a painful amount just crossing the spread.
The timing: Cameco reported that same morning and missed badly (adjusted EPS $0.18 vs $0.38 expected) while raising revenue guidance. The stock popped to $92.02 pre-market, then round-tripped to ≈$87. This buyer stepped in during the fade.
The catch: the $74 strike sits below the entire published sell-side range — the lowest street target is $84.42 — and no earnings lands inside the contract's life (Cameco next reports October 30, 49 days after expiry). At $1.12 and ≈15% out of the money, most options like this expire worthless. Full breakdown →
📅 Upcoming Catalysts — and the Expiration Each One Actually Affects
⚠️ A catalyst only matters to a contract if it lands before that contract expires. Several of today's expirations miss their own company's next earnings entirely.
Date | Event | Status | Which expiration it lands inside |
|---|---|---|---|
Aug 4, 2026
(after close) | GXO
Q2 earnings, call Aug 5 | ✅ Company-confirmed | GXO
Aug-21-2026 |
≈Aug 6, 2026
(after close) | MCHP
fiscal Q1 2027 | 🟡 Expected, not confirmed | MCHP
Sep-18
and
Dec-18 |
Aug 6, 2026 | TIGO
(Millicom) Q2 2026 results | ✅
Company-confirmed
(release dated Jul 27) | TIGO
Aug-21-2026
— inside the expiry |
Aug 7 / Aug 12 | July jobs / July CPI | ✅ Confirmed | Macro —
SPY both butterflies , QQQ
Jan-2028 , SMH
2027/2028 |
Aug 5, 2026
(1:30pm PT) | SNDK
fiscal Q4 + FY2026 earnings | ✅
Company-confirmed | SNDK
Aug-07-2026
— the roll deliberately moved the position
over
this print |
Aug 13, 2026 | SNDK
Investor Day | ✅ Company-confirmed | ❌ Falls
after
the Aug-07 expiry |
Late Aug 2026 | Kazatomprom
1H results + 2027 production plan | 🟡 Expected | CCJ
Sep-11-2026
— highest-probability mover inside that put |
Aug 26, 2026 | NVIDIA
FQ2 earnings + July PCE | ✅ Confirmed | SPY both butterflies ; SMH
both ; QQQ
Jan-2028 |
Sep 1, 2026 | AAPL
— Tim Cook hands CEO role to John Ternus | ✅ Confirmed | ❌ After today's 0DTE contracts died |
≈Sep 9, 2026 | AAPL
iPhone 18 Pro + first foldable event | 🟡 Expected | ❌ Outside today's AAPL contracts |
Sep 9–11, 2026 | World Nuclear Symposium , London | ✅ Confirmed | CCJ
Sep-11-2026
— runs
through
expiry day |
Sep 15–16, 2026 | FOMC + first full dot plot under Chair Warsh | ✅ Confirmed | SPY both butterflies
— the biggest scheduled risk inside them; QQQ, SMH |
Sep 30, 2026 | SPY's first butterfly expires | ✅ Contract date | Pays only if the S&P 500 is near
535
that day |
Oct 16, 2026 | SPY's second butterfly expires | ✅ Contract date | Pays only if the S&P 500 is near
525
that day |
≈Sep 30, 2026 | MCHP closes the Hailo acquisition | 🟡 Expected | MCHP
Dec-18
only |
≈Oct 2, 2026 | TSLA
Q3 delivery report | 🟡 Expected | TSLA
Dec-2028 |
≈Oct 22, 2026 | AMZN
Q3 earnings | 🟡 Expected, not confirmed | AMZN
Nov-20
only — Sep-18 expires ≈5 weeks before |
≈Oct 28, 2026 | TSLA
Q3 earnings | 🟡 Provider-listed | TSLA
Dec-2028 |
≈Oct 29, 2026 | SBUX
Q4 + FY2026 ·
AAPL
FQ4 (Ternus's first call) | 🟡 Expected | SBUX
Jan-15-2027
— the only earnings inside it |
Jul 30, 2026 | HNI
Q2 2026 — already reported (EPS $1.27 vs $1.04; FY guide raised to +20–25%) | ✅ Reported | ❌ Behind the trade — the spread went on the
next day |
Oct 30, 2026 | CCJ
Q3 earnings | ✅ Company-confirmed | ❌
Nothing
— 49 days
after
the Sep-11 put expires |
≈Late Oct 2026 | HNI
Q3 2026 | 🟡 Estimated, not company-confirmed | ❌ ≈5 weeks
after
the Sep-18 expiry |
≈Nov 5, 2026 | MCHP fiscal Q2 2027 | 🟡 Expected | MCHP
Dec-18
only |
Nov 16, 2026 | GXO Investor Day at the NYSE | ✅ Confirmed | ❌ Outside the Aug-21 expiry |
Dec 8–9, 2026 | FOMC + final 2026 projections | ✅ Confirmed | Macro — QQQ, SMH |
≈Late Jan 2027 | SBUX holiday-quarter results | 🟡 Expected | ❌
After
the Jan-15-2027 expiry — those calls capture holiday
sentiment , never the holiday
numbers |
👥 How Four Different Traders Should Read This Board
🎲 The YOLO Trader
SPY's butterflies will call to you — a ≈100:1 payoff ratio is exactly the kind of number that ends badly. Read it carefully: that ratio is the payoff at one exact price on one exact day, and the body sits ≈28% below spot. The realistic outcome is a total loss of premium. Institutions can wear that as a rounding-error hedge line; a retail account cannot.
CCJ is the only clean directional ticket, and the cheapest at $1.12. Respect what that price means: ≈15% out of the money, six weeks, and no earnings catalyst inside it. The market prices a low probability because it is one. If you take it, size it as money you can lose entirely.
What you should not do: chase AAPL or SNDK because the dollar figures are enormous. AAPL's $124M is a financing trade with no direction, and SNDK's $70M "call buy" is one leg of a roll — the actual new money is $31M. If SanDisk's August 5 print tempts you, note the setup: forward P/E ≈6.8 versus ≈42 trailing is the classic peak-cycle-earnings signature, and the stock is already ≈46% below its June high.
📈 The Swing Trader
Two names deserve your attention for opposite reasons. MCHP has genuine tension: bookings have inflected (April was the largest booking month in nearly four years) and Texas Instruments corroborated the industrial recovery, yet the stock is ≈28% off its June high on sector beta. Earnings ≈Aug 6 resolves it.
SMH is the counterweight — someone just paid $51.7M for in-the-money downside protection on the whole sector out to June 2027. Holding a bullish chip view is fine; holding it without noticing that trade is not.
Watch AMZN's $240 level too. The desk that rolled there chose it deliberately.
💰 The Premium Collector
Today is a masterclass in what institutional premium harvesting actually pays. GXO captured $0.17 of time value on a $50.50 stock — ≈5.9% annualized — with zero directional exposure because it was hedged instantly. AAPL's conversion captured a one-cent spread on ≈$904M. That is the real world: tiny edges, enormous size, no risk taken.
If a retail "covered call" screen is showing you 40% annualized, you are being paid for risk, not for time. And note the trade you should not copy: QQQ's short $600 put and SMH's naked 2028 call both carry open-ended obligations. Cash-secured or not at all.
🌱 The Beginner
The single most useful idea on this page: the headline dollar number is usually wrong.
AAPL looked like a $124M bearish bet. It had no direction at all. QQQ looked like a $17M call buy — real money was $5.55M. AMZN looked like a $98M bet; it was a $49M roll of a position that already existed. SNDK looked like a $70M call purchase; it was one half of a roll costing $31M.
Three habits worth building from today:
You do not need to trade any of this. Reading it correctly for a few weeks is worth more than one rushed position.
⏳ Every Read Here Is Provisional Until Tomorrow Morning
Come back next trading day pre-market (≈06:30 ET). The next-day open-interest snapshot is the only thing that proves whether these positions were opened or closed, and we publish the resolution — including when it contradicts what we wrote.
Where today's tape already settled it:
- ✅ Proven opens: CCJ $74 put and both HNI legs (prior OI 0 — those contracts did not exist before today), SMH $730 call (prior OI 3), TIGO $100 call (prior OI 96), all six SPY butterfly legs (150,000–300,000 contracts against prior open interest of just 425–5,778), SNDK $800 call (prior OI 30), SMH $625 put (prior OI 49), MCHP $65 call (prior OI 50), AAPL $260 call (prior OI 116), TSLA $175 put (prior OI 167), plus TSLA's $250 put and AMZN's $240 call.
- ⏳ Cannot be proven yet: AMZN's $220 call, MCHP's $85 call, QQQ's $600 put, SBUX's $110 call and TSLA's $400 call all traded in sizes below existing open interest. Tomorrow's OI is the test: OI up ≈ the print size = opened; OI down = closed.
- ⚠️ Two legs can never be resolved this way. AAPL's pair and SNDK's $1,000 call all expired today, so no next-day open interest will ever exist for them. Their classification rests on the structure and the economics — permanently. We would rather tell you that than pretend the check is coming.
- ⏳ Marginal: QQQ's $800 call had only 290 contracts provably new; SBUX's $105 call only 439.
⚠️ Risk & Reality Check
Institutional flow tells you what large accounts did. It never tells you their reason, their holding period, what else is in the book, or whether they are right.
Today makes that unusually clear. ≈$131M of the headline carried no directional information at all, and two of the largest tickets were rolls of positions that already existed. Two more — SPY and QQQ — arrived in the feed with legs missing, which changed what they meant entirely. The genuinely new, genuinely directional money is a much smaller number than $324M.
And a specific caution on the SPY butterflies: a headline like "≈$3.0B of potential payoff" is a maximum at one exact index level on one exact day, not an expectation. The most likely outcome for a deep out-of-the-money butterfly is that it expires worthless. Someone buying insurance is not a forecast that the house will burn down.
What the tape cannot tell us: who traded, whether they own the underlying shares, whether an offsetting position exists elsewhere, or the sign of the open interest already there. One more caution: large prints can be cancelled by the exchange hours later — that is exactly what happened to yesterday's SMH ticket, and it took $4.4M off a number we had already published.
Practical discipline: size positions so a total loss is survivable, prefer defined-risk structures, never sell naked options against an index, and let the next-day open-interest check confirm a read before you build around it. Patience costs nothing. Chasing a headline premium number has cost a lot of people a lot of money.
This is market analysis and education, not investment advice. Options carry substantial risk of loss, including total loss of premium paid. Do your own research.

Ainvest Option Flow Digest is published daily, analyzing institutional options positioning to help retail traders understand smart money flows. Subscribe for daily updates and in-depth analysis.
Unlock Market-Moving Insights.
Subscribe to PRO Articles.
Already have an account? Sign in






