
Catch pre-market movers with AI signals.
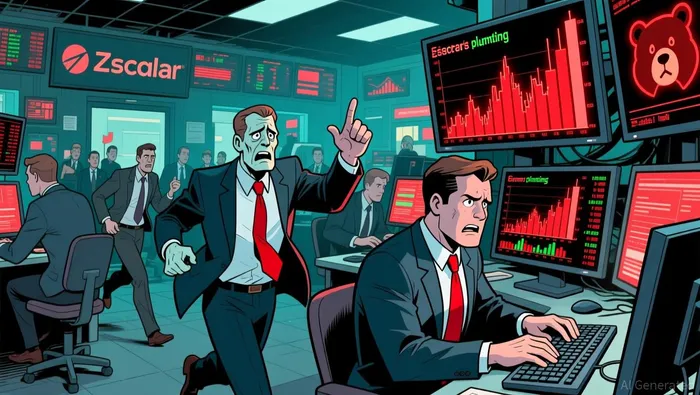
Zscaler Implodes 6.8% Intraday: Is This a Bearish Flash or a Deep Correction?
Summary
• ZscalerZS-- (ZS) plummets to $130.85, a 6.84% drop in under 3 hours.
• Traders scramble as the stock trades below both its 30-day and 200-day moving averages.
• Options on the May 1 put chain see massive volume, hinting at bearish bets.
Zscaler’s midday plunge has stunned both institutional and retail traders, bringing the stock down to a level not seen since late 2024. Despite a relatively quiet news calendar, the technicals and options activity scream bearish urgency. With the stock trading far below key moving averages and volatility surging in the put options, the question now is whether this is a short-term panic or a long-term bear market play.
Bearish Momentum and Volatility Fueled by Put-Driven Panic
Zscaler's sharp selloff has been fueled by a combination of short-term bearish momentum and heavy put buying in the options market. The stock has already traded below its 30-day moving average of $140.40 and is now nearly 50% below its 200-day moving average of $239.40, a sign of deep bearish conviction. The RSI is at 55.5, indicating moderate bearish pressure, while the MACD is negative with a bullish histogram, suggesting a battle between short-term buyers and long-term bears. The heavy activity in the May 1 put chain with strikes from $116 to $130 further confirms the market's bearish expectations.
Information Tech Sector Quiet as Amazon Holds Steady Gains
Zscaler’s sharp drop has not been mirrored in its broader sector. The Information Technology - Internet & Direct Marketing Retail sector remains relatively stable, with Amazon (AMZN) posting a modest intraday gain of 1.32%. While ZSZS-- is under heavy pressure, the sector as a whole is not reacting in kind, suggesting the move is more stock-specific than a broader industry correction. However, the sector’s lack of upward momentum could limit potential support for ZS if the broader market shifts tone.
Bullish ETFs Absent: Focus on May Put Options as Bearish Bets Take Center Stage
• 30-day MA: 140.398 (Below)
• 200-day MA: 239.400 (Far Below)
• RSI: 55.539 (Moderate Bearish)
• Bollinger Bands: Upper $149.24 | Middle $134.45 | Lower $119.66
• MACD: -4.40 (Bearish) | Signal: -6.855 | Histogram: +2.451 (Bullish divergence)

The chart suggests a volatile cross between bearish fundamentals and short-term buying interest. Traders should watch the $134.45 mid-Bollinger Band as a potential short-term floor. For options traders, the heavy put buying on the May 1 chain provides a clear signal. Here are the top bearish options to consider in a 5% downside scenario (to $126.26):
• ZS20260501P128ZS20260501P128--
• Type: Put
• Strike Price: $128
• Expiration Date: 2026-05-01
• IV: 67.32% (High)
• LVR: 40.98% (High)
• Delta: -0.330881 (Moderate)
• Theta: -0.057459 (High Time Decay)
• Gamma: 0.025755 (High Sensitivity)
• Turnover: 162,160 (High Liquidity)
This put contract offers a balance of leverage and liquidity, with strong sensitivity to price movement (high gamma) and significant implied volatility. In a 5% downside, the put would likely gain value due to time decay and price sensitivity. A 5% drop from $132.9 would bring the stock to $126.26, yielding a $1.74 payoff (max(K - ST, 0)) for this $128 put.
• ZS20260501P129ZS20260501P129--
• Type: Put
• Strike Price: $129
• Expiration Date: 2026-05-01
• IV: 66.24% (High)
• LVR: 37.51% (High)
• Delta: -0.356418 (Strong)
• Theta: -0.043175 (Moderate Time Decay)
• Gamma: 0.026914 (High Sensitivity)
• Turnover: 40,946 (High Liquidity)
This contract has strong delta and high gamma, making it ideal for short-term bearish moves. With high implied volatility and moderate time decay, it offers a compelling short-term bet on further declines. In the same 5% bear scenario, the $129 put would yield a $2.64 payoff. Traders should watch the $128 and $129 put chains as liquidity is highest here, and these strikes align with the Bollinger Lower Band and key support levels.
Hook-style recommendation: If $134.45 breaks and the stock heads toward $128, ZS20260501P128 becomes a powerful bearish play.
Bottom-Fishing Risks Rise as Put Bets Outpace Calls
Zscaler’s continued slide into bear territory suggests that traders are positioning for a potentially deep correction rather than a temporary dip. With the stock far below all major moving averages and heavy put buying evident, a short-term rebound may be limited in scope. Investors should closely monitor the $134.45 mid-Bollinger Band and $128 support levels for signs of stabilization or further breakdown. In a broader context, Amazon’s modest gains highlight the sector’s overall resilience, but ZS appears to be in a separate bearish orbit. Traders should consider bearish options on the May 1 chain as the main action remains in the puts. Watch for $128 support or regulatory reaction next.

TickerSnipe provides professional intraday stock analysis using technical tools to help you understand market trends and seize short-term trading opportunities.







Commentaires
Pas encore de commentaires