
XRP Price Breaks $2.35 Resistance, Eyes $2.70 Target as ETF Inflows Continue
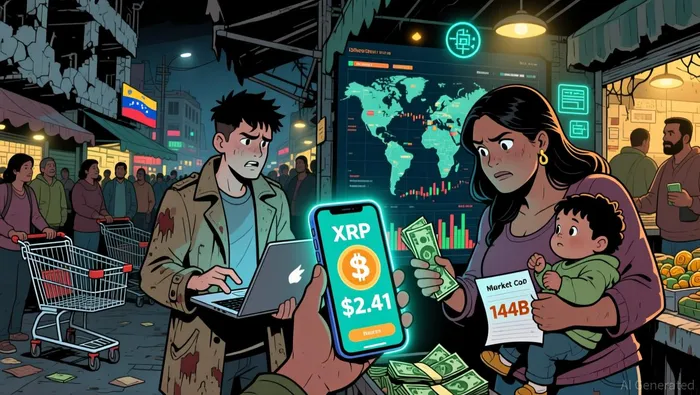
XRP rose 12.6% on January 6, 2026, reaching $2.41 before consolidating at $2.38. The move pushed XRP’s market capitalization to $144 billion, surpassing BNB and reclaiming the fourth-largest digital asset position. This surge followed a geopolitical development in Venezuela, where U.S. forces captured leader Nicolás Maduro, triggering a shift in capital toward crypto assets.
The rally resulted in the liquidation of $25 million in XRP short positions, contributing to a broader $320 million liquidation of short bets in the crypto market. XRP’s move above $2.35 marks a critical technical level, aligning with the 200-day EMA and signaling potential for a continuation of the upward trend.
The price action is supported by steady institutional ETF inflows and tightening liquidity from falling exchange balances. U.S.-based XRP ETFs recorded $64 million in inflows in early January 2026, while BitcoinBTC-- and EthereumETH-- ETFs saw outflows.
Why Did This Price Move Happen?
 XRP’s breakout from a falling wedge pattern indicates a bullish reversal, often seen during corrective phases in broader uptrends. This pattern formed over months as prices posted lower highs and lower lows within a narrowing channel. A successful breakout from this wedge suggests weakening downside momentum and sets the stage for a potential move toward $2.60–$2.70 by February.
The Wyckoff reaccumulation model also supports the case for a bullish continuation. XRPXRP-- began stabilizing in late 2024 after establishing a base near $1.20, then spent most of 2025 consolidating below $1.90–$2.00. A brief dip below $1.70 in late 2025, followed by a swift rebound, signaled seller exhaustion.
How Are Markets Responding to XRP’s Move?
XRP ETFs have shown consistent inflow behavior, with cumulative inflows reaching $1.14 billion. Franklin Templeton’s XRP ETF contributed $28.6 million in weekly inflows, followed by Bitwise with $19 million. This institutional demand is absorbing supply, which has historically preceded stronger price moves.
Exchange balances held on centralized platforms have dropped to multi-year lows, reducing available sell-side liquidity. This reduction in supply could increase sensitivity to consistent demand, although it does not guarantee a price increase.
What Are Analysts Watching Next?
Analysts are monitoring XRP’s ability to hold the $2.35 zone. A failure to maintain this level could signal a bearish retest of moving averages, potentially pushing the asset back into its prior consolidation range. If XRP sustains its position above $2.35, it could flip this previous resistance into a solid support level.
Standard Chartered predicts XRP could reach $8 by the end of 2026, factoring in regulatory clarity and ETF inflows. A more conservative scenario forecasts a climb to $3 if current demand and supply trends continue without major market disruptions.
Technical indicators like the RSI and MACD are also under close observation. XRP’s RSI is currently at 87, signaling overbought conditions. Historically, when the RSI exceeds 70, XRP often undergoes a 5–10% mean reversion before continuing its move.
Geopolitical developments and macroeconomic conditions will continue to influence market sentiment. The geopolitical event in Venezuela contributed to a shift in capital toward crypto assets, highlighting the role of external factors in price movements.
Analysts also highlight the January 1 billion XRP escrow unlock as a potential catalyst for increased volatility. While much of the unlocked supply is expected to be re-escrowed, the event often increases market activity, especially when prices are compressed near major support levels.
The broader crypto market responded to XRP’s rally with a total valuation increase of over $250 billion since January 1. This momentum suggests that XRP’s performance is part of a broader trend in the crypto market.
What Could Halt XRP’s Momentum?
A failure to hold the $2.35 zone could result in a bull trap, with the price slipping back below $2.26. This would signal a bearish retest of the moving averages and could push XRP back into its consolidation range.
On-chain data also indicates fading network activity, with daily active addresses declining to around 19,000. This contraction suggests weakening organic demand, which could make it harder for XRP to absorb fresh supply.
Derivatives flow data reinforces bearish sentiment, with the taker buy/sell ratio consistently below 1. This indicates that sell-side market orders dominate, with rallies being sold into rather than chased higher.
A decisive break below $1.77 could open a move toward the $1.00–$0.80 demand zone. While ETF inflows remain supportive, short-term price action is still driven by spot demand and derivatives activity. Until demand returns and open interest settles, downside risks remain elevated.


Comentarios
Aún no hay comentarios