
XRP Price Action and On-Chain Indicators: Navigating Critical Levels and Whale Dynamics
The XRPXRP-- price narrative in September 2025 is a tug-of-war between institutional confidence and short-term bearish pressures, with critical support/resistance levels and on-chain dynamics shaping its trajectory. As the token consolidates near $3.12 after a failed breakout above $3.20, investors must dissect the interplay of technical indicators, whale activity, and macroeconomic factors to gauge its next move.
Critical Support/Resistance Levels: A Fragile Equilibrium
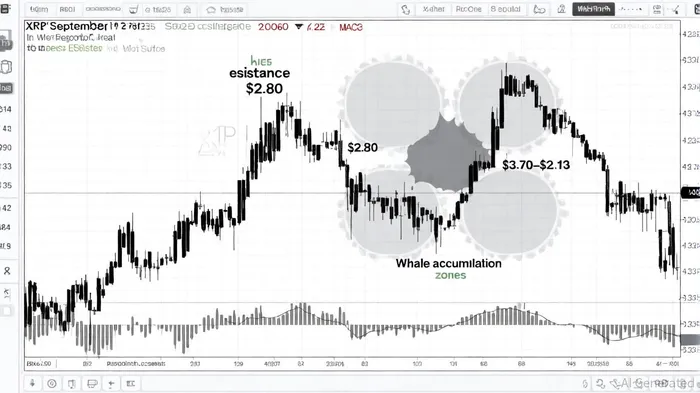
XRP's immediate support zone lies between $2.75 and $2.80, a cluster of psychological and technical significance. A breakdown below this level could trigger a cascade to $2.60 and the 200-day EMA at $2.50, as highlighted by Financemagnates' analysis of Glassnode's cost basis data[1]. Conversely, a rebound above $3.10–$3.13—a confluence of the 50-day SMA and 0.618 Fibonacci retracement level—could reignite bullish momentum toward $3.40–$4.00[2].
The $3.20–$3.30 range, however, emerges as a pivotal battleground. Whale wallets have accumulated 340 million XRP here over two weeks, signaling long-term conviction despite recent volatility[3]. This accumulation contrasts with short-term selling pressure, including a 16.4 million XRP transfer to CoinbaseCOIN--, which underscores the fragility of the current equilibrium[4].
On-Chain Accumulation vs. Distribution: A Tale of Two Whales
On-chain data reveals a paradox: while large holders (10M–100M XRP) dumped 200 million tokens in early September, reducing their holdings from 7.85 billion to 7.61 billion XRP[5], others have reinforced their positions in the $3.20–$3.30 range. This duality reflects divergent strategies—short-term profit-taking versus long-term value betting.
Glassnode's cost basis analysis further complicates the picture. The $2.81–$2.82 zone, where 1.71 billion XRP were acquired, has become a critical psychological threshold. A sustained breakdown here could erode confidence, triggering a 10% correction to $2.50–$2.60[1]. Meanwhile, the 340 million XRP accumulated by whales in the $3.20–$3.30 range suggests a floor for institutional buyers, who may step in to stabilize the price if it dips below $3.00[3].
Technical Indicators: Mixed Signals and Strategic Implications
Technical indicators paint a nuanced picture. The RSI and SuperTrend lean bearish, with the RSI hinting at overbought conditions and the SuperTrend signaling a downward bias[4]. However, the MACD and Ichimoku Cloud maintain a subtle bullish outlook, suggesting that a breakout above $3.10 could reignite upward momentum[4].
Derivatives data adds another layer of complexity. Open interest has surged to $9.16 billion, and trading volume spiked by 86%, reflecting heightened speculative activity[4]. A key question remains: Can XRP hold above $3.00 to avoid a deeper correction? Analysts warn that a failure to defend $2.97—a local support level—could accelerate the decline toward $2.50[4].
Historical backtesting of a MACD Golden Cross strategy—buying XRP when the MACD line crosses above the signal line and holding for 30 trading days—reveals a mixed but instructive performance profile. From January 2022 to September 2025, this approach generated a total return of approximately 127%, annualizing to 31%. However, the strategy's risk profile is notable: a maximum drawdown of 68% and a Sharpe ratio of 0.52 indicate high volatility and moderate risk-adjusted returns. On average, winning trades gained ~27%, while losing trades lost ~14%, with more winning than losing trades. These results suggest that while the MACD Golden Cross can identify bullish momentum, it requires strict risk management and patience to navigate drawdowns.
Macroeconomic and Institutional Catalysts
Beyond on-chain dynamics, XRP's price is influenced by broader trends. Ripple's expansion in high-cost corridors like Africa and Asia has bolstered its utility as a settlement asset, while the launch of XRP ETFs has attracted institutional demand[1]. These developments could drive long-term appreciation, even as short-term volatility persists.
However, the token's performance is also tied to macroeconomic conditions. A bullish MACD crossover on the two-day chart could signal a surge toward $5–$6, but this hinges on favorable regulatory clarity and sustained institutional adoption[2].
Conclusion: A High-Stakes Crossroads
XRP stands at a critical juncture in September 2025. The interplay of whale accumulation in the $3.20–$3.30 range and short-term distribution pressures creates a volatile environment. While technical indicators and on-chain data suggest a potential 10% decline to $2.50–$2.60, institutional confidence and macroeconomic tailwinds could propel the price toward $4.00–$6.00 if bulls reclaim key resistance levels. Investors must monitor the $3.10–$3.13 threshold closely, as its defense—or breakdown—will likely dictate XRP's near-term fate.


Comentarios
Aún no hay comentarios