
XRP: A High-Probability Breakout Candidate Amid Contrarian Signals and ETF-Driven Momentum
In the ever-shifting landscape of digital assets, XRPXRP-- has emerged as a compelling case study in market divergence. On one hand, on-chain data reveals aggressive whale selling and bearish sentiment; on the other, ETF inflows and technical patterns suggest a potential breakout. For contrarian investors, this dislocation between fundamentals and price action creates a rare opportunity to assess whether XRP is poised to reverse its trajectory-or collapse further.
On-Chain Divergence: Whale Selling vs. Accumulation
The XRP market in 2025 has been defined by a paradox. Large holders sold approximately 200 million XRP within two days of the Canary XRPC ETFXRPC-- launch, signaling significant outflows. Yet, whale accumulation has reached a seven-year high, with fewer but larger wallets hoarding significant amounts of XRP. This duality reflects a tug-of-war between short-term profit-taking and long-term conviction.
The contradiction deepens when examining institutional activity. The XRP Ledger experienced an abnormal spike in configuration transactions, suggesting large-scale institutional operations. While this could indicate preparation for a major move, it also raises questions about whether these actors are accumulating for a bullish bet or hedging against a potential downturn.
Technical Patterns: A Triangle of Opportunity
From a technical perspective, XRP's price chart has formed a symmetrical triangle pattern near $2.65-a structure historically associated with explosive breakouts. This pattern mirrors Bitcoin's consolidation phase before its 2024 rally, adding a layer of psychological significance. Analysts have identified a Wave 3 Elliott Wave structure, projecting a target of $2.62 if the pattern holds. However, a breakdown below $2.31 would invalidate the bullish case, opening the door to a move toward $1.80–$1.87.
November 2025 brought further clarity. After a 12% surge to $2.58 driven by 11 new XRP ETFs entering the DTCC's pre-launch list, the price consolidated near $2.40. This consolidation, combined with a 42% month-over-month increase in on-chain velocity and daily active addresses hitting 29,000, suggests that retail and institutional buyers are testing key levels. 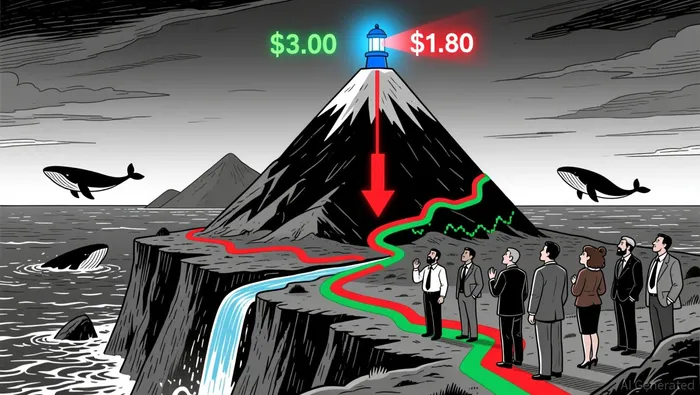 Traders are now watching $2.00 and $2.07 as critical support zones.
ETF Momentum: A Double-Edged Sword
The launch of XRP ETFs has introduced a new dynamic. Despite whale selling, net inflows into XRP ETFs reached $644 million, reflecting strong institutional demand. This influx has created a dislocation between market fundamentals and price action, as ETF-driven buying has yet to fully offset whale outflows. However, the $500 million funding round for Ripple at a $40 billion valuation and expanding RLUSD partnerships provide a tailwind for long-term adoption.
The key question is whether ETF inflows will eventually outweigh bearish on-chain signals. Historically, increased on-chain activity has preceded price rallies, and the current surge in transaction volume could be a precursor to a similar move.
Contrarian Case: Strategic Entry Point
For investors willing to navigate the volatility, XRP presents a high-probability setup. The divergence between whale selling and accumulation, combined with ETF-driven momentum and a forming triangle pattern, suggests a potential inflection point. If the price holds above $2.31, the triangle pattern could propel XRP toward $2.62 or even $3.50. Conversely, a breakdown below $2.05 would signal a deeper correction.
The risk-reward profile is asymmetric. Short-term bearish signals, including a 7% drop to $2.05 in late November, highlight the need for caution. Yet, the long-term fundamentals-regulatory clarity, institutional adoption, and RLUSD's growth remain robust. For contrarians, this divergence between fear and fundamentals could be the catalyst for a breakout.
Conclusion
XRP's current trajectory is a masterclass in market psychology. Whale selling and bearish sentiment create a narrative of weakness, while ETF inflows and technical patterns hint at a potential reversal. For investors with a medium-term horizon, the $2.00–$2.40 range represents a strategic entry point. The coming weeks will test whether XRP can break free of its triangle pattern-or succumb to the weight of its bearish undercurrents.

Comentarios
Aún no hay comentarios