
Is XRP's Correction Nearing Its End? A Technical Breakdown of Key Support Levels
Fibonacci Retracements: A Confluence of Key Levels
CasiTrades' analysis highlights a critical technical zone for XRP, where multiple Fibonacci retracement levels converge. The 38.2% retracement sits at approximately $2.0775, while the 50% level is at $1.9896. These levels act as potential support regions, with the price currently testing the $2.00–$1.90 range as part of a textbook A-B-C corrective pattern according to technical analysis.
A deeper look reveals the 0.618 retracement level at $1.46, which CasiTrades identifies as a critical threshold for a potential reversal. If XRP fails to hold above this level, it could signal a continuation of the correction, with further downside risk to the "golden pocket" around $1.35-a zone historically associated with accumulation and reversal. Conversely, a rebound from $1.46 could validate a bullish setup, particularly if it aligns with broader market conditions. 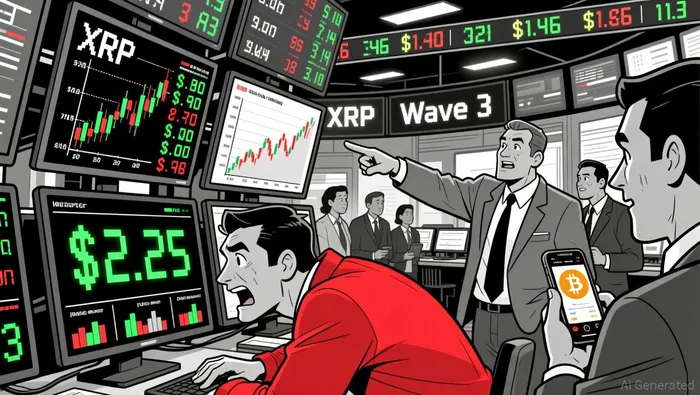


Comentarios
Aún no hay comentarios