
XRP's 2026 Price Potential: Breakout Structures and Relative Strength Indicators Signal a Bullish Reversal
The cryptocurrency market has long viewed XRPXRP-- as a barometer for institutional adoption and regulatory clarity. By mid-2026, the asset's technical and on-chain dynamics suggest a compelling case for long-term bullish positioning, driven by evolving breakout patterns, diverging relative strength indicators, and a surge in accumulation activity. This analysis synthesizes recent data to outline strategic entry points and the broader narrative shaping XRP's trajectory.
Breakout Structures: A Confluence of Technical Catalysts
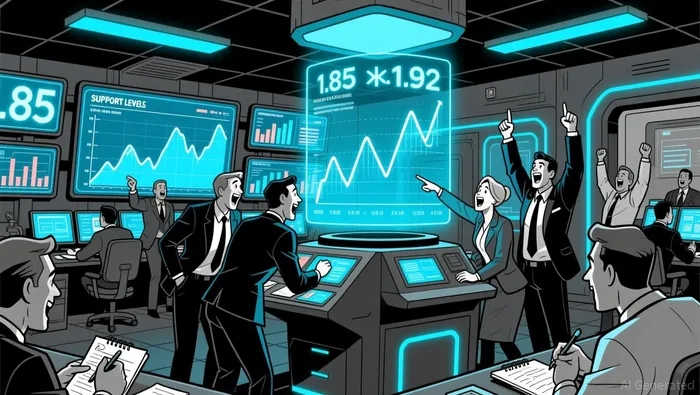
XRP's price action in early 2026 reveals a critical inflection point. After a prolonged bearish phase in late 2025, the asset's Stochastic RSI hit 0.00-a rare signal last observed at the 2022 market bottom-indicating exhausted selling pressure. Concurrently, the daily RSI displayed a bullish divergence, a pattern historically preceding uptrends (e.g., 2022's $0.28 level). By mid-2026, XRP's price stabilized between $1.91–$1.92, with critical support at $1.85–$1.90. On-chain data confirmed buying pressure at these levels, suggesting a potential base for a breakout.
The MACD, a key momentum indicator, also showed mixed signals. While the weekly MACD remained negative, reflecting lingering bearish momentum, the daily histogram stalled at 0.0000, with the MACD line slightly above the signal line. This alignment hints at a potential reversal or consolidation phase, particularly if the price breaks above $2.42-a critical resistance level. Such a move could trigger a rally toward $2.75 in the short term and $4.81 in 2026, assuming sustained buying interest.
Relative Strength Indicators: From Oversold to Neutral Territory
XRP's RSI evolution from Q4 2025 to mid-2026 underscores a shift in market sentiment. In Q4 2025, the RSI hovered near oversold territory (42.07), signaling diminished selling pressure and a potential bounce. By mid-2026, the RSI stabilized at 54.03, entering neutral territory-a range that historically precedes directional moves. This transition, coupled with a Taker Buy/Sell Ratio of 0.991 (its highest since late November 2025), indicates buyers are increasingly absorbing sell-side pressure.
The MACD's behavior further reinforces this narrative. While the indicator remained bearish on weekly charts, shorter-term bullish crossovers emerged, suggesting momentum could shift in favor of buyers. This divergence between timeframes is a classic setup for a breakout, particularly if institutional demand-reflected in ETF inflows-continues to grow.
On-Chain Metrics: Accumulation and Reduced Selling Pressure
On-chain data paints a picture of renewed confidence among long-term holders. Whale wallets added over 190 million XRP in July 2025, and by mid-2026, the total number of addresses holding significant balances reached a five-year high. This accumulation, combined with a decline in XRP's supply in profit from 64 billion to 37 billion, suggests reduced selling pressure and a potential sustained recovery.
Derivatives markets also reflect a shift in positioning. The Taker Buy/Sell Ratio's improvement to 0.991 and the derivatives ratio approaching neutral 1.0 indicate a transition from fear-driven selling to balanced positioning. Additionally, XRP's price recovery above $2.10-a level not seen since late October 2025-signals improved buyer control.
Strategic Entry Points and Long-Term Positioning
For investors, the key levels to monitor are $1.85–$1.90 (support) and $2.42 (resistance). A breakout above $2.42 could validate the bullish case, with $2.75 as an immediate target. Meanwhile, the RSI's neutral reading and MACD's mixed signals suggest a consolidation phase is possible, making $1.91–$1.92 a strategic entry range for those seeking to capitalize on a potential rebound.
Long-term bullish positioning is further supported by XRP's ecosystem developments. The launch of Confidential Multi-Purpose Tokens (MPTs) in Q1 2026, which enable privacy-enhanced token transfers, and the Payment Engine Formal Spec upgrade-enhancing transaction reliability-position XRP as a scalable solution for real-world asset tokenization. These upgrades, combined with ETF-driven demand totaling $1.21 billion in December 2025, create a robust foundation for sustained growth.
Conclusion
XRP's 2026 price potential hinges on a confluence of technical, on-chain, and macroeconomic factors. Breakout structures, evolving RSI/MACD dynamics, and accumulation activity all point to a scenario where the asset could reclaim its 2021 highs. While short-term volatility remains a risk-particularly if the RSI overextends beyond 70-strategic entry points and a focus on institutional adoption metrics offer a compelling case for long-term bullish positioning. As the market navigates this inflection point, XRP's unique blend of technical strength and ecosystem innovation may prove to be a defining catalyst for 2026.


Comentarios
Aún no hay comentarios