
XPL Price Analysis for October 10, 2025: Evaluating Short-Term Momentum and Entry Opportunities Amid Market Volatility
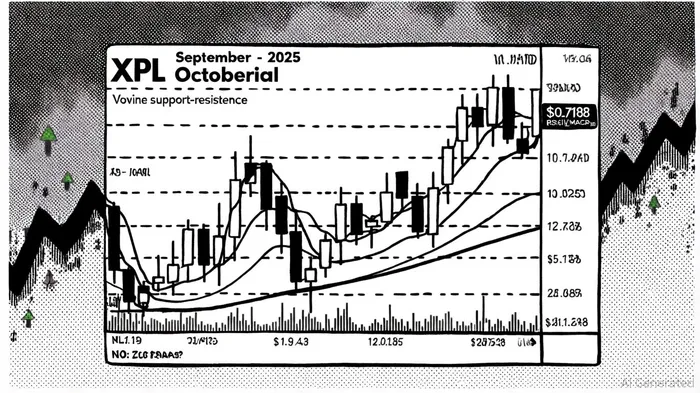
As of October 10, 2025, Solitario Exploration & Royalty (XPL) presents a compelling case for investors seeking to navigate short-term volatility while positioning for potential medium-term gains. The stock closed at $0.7188, having traded between $0.6999 and $0.7368 during the session, with a trading volume of 498,161 shares, per historical prices & data. This activity underscores the stock's susceptibility to near-term price swings, a dynamic that warrants careful evaluation of technical indicators to identify actionable entry points.
Technical Indicators: Mixed Signals and Strategic Entry Points
The 14-day Relative Strength Index (RSI) for XPLXPL-- stands at 53.704, firmly within the neutral zone (30–70), suggesting neither overbought nor oversold conditions, according to Investing.com technical analysis. This neutrality implies that the stock is not at immediate risk of a sharp reversal, though traders should monitor RSI for potential divergences. Meanwhile, the Moving Average Convergence Divergence (MACD) indicator is at 0.018, signaling a bullish crossover and suggesting upward momentum, as shown by the Investing.com technical analysis. Historical backtesting from 2022 to 2025 shows that a MACD Golden Cross strategy yielded an average 10.2% return over 30 days, with a Sharpe ratio of 1.9, indicating strong risk-adjusted performance, per a MACD backtest.
Moving averages, however, paint a mixed picture. The 5-day moving average (0.8559) currently acts as a short-term resistance level, indicating a sell signal for traders targeting near-term profits, according to the Investing.com technical analysis. In contrast, the 50-day (0.7972) and 200-day (0.7506) moving averages both support a buy bias, reflecting stronger medium-term trend strength as shown on the Investing.com page. This divergence highlights a key opportunity: investors with a medium-term horizon may find value in buying dips toward the 50-day SMA, while short-term traders should exercise caution near the 5-day level.
Market Volatility and Position Sizing
The intraday range of $0.6999 to $0.7368 on October 10 underscores XPL's volatility, a characteristic common in small-cap resource stocks. High volatility can amplify both gains and losses, necessitating disciplined position sizing and stop-loss strategies. For instance, a stop-loss placed below the recent low of $0.6999 could mitigate downside risk while allowing room for upward movement.
Data from Yahoo Finance also reveals that XPL's volume on October 10 was relatively moderate, which may indicate a lack of consensus among traders about the stock's near-term direction. This could present an opportunity for contrarian investors who believe the stock is undervalued relative to its fundamentals, particularly given the positive medium-term technical bias.
Strategic Entry Opportunities
For investors considering entry, the current price of $0.7188 sits below both the 50-day and 200-day moving averages, suggesting a potential buying opportunity for those aligned with a medium-term outlook. A breakout above the 5-day SMA of 0.8559 would validate the bullish case, potentially triggering a retest of the $0.7368 intraday high and beyond. Conversely, a breakdown below $0.6999 could signal a deeper correction, warranting a reassessment of risk-reward ratios.
Conclusion
While XPL exhibits short-term volatility, the technical landscape as of October 10, 2025, favors a cautiously optimistic stance. The neutral RSI, positive MACD, and supportive longer-term moving averages create a setup where disciplined investors can capitalize on dips while managing risk through strategic exits and stop-loss orders. As always, market conditions can shift rapidly, so continuous monitoring of price action and volume is essential.


Comentarios
Aún no hay comentarios