
What a Coincidence! Indian stock market Mimics NASDAQ bubble pattern
There are many coincidences in this world, and financial markets are no exception. As shown in the chart, the MSCI India Index and the NASDAQ Index during the bubble period (1994-2001) exhibit strikingly similar trends! Even the PB valuation levels align so closely.
According to the chart’s trend, if the Indian index were to reach the NASDAQ's peak level of that time, it could increase fivefold! Should we then go ALL IN on the Indian market?
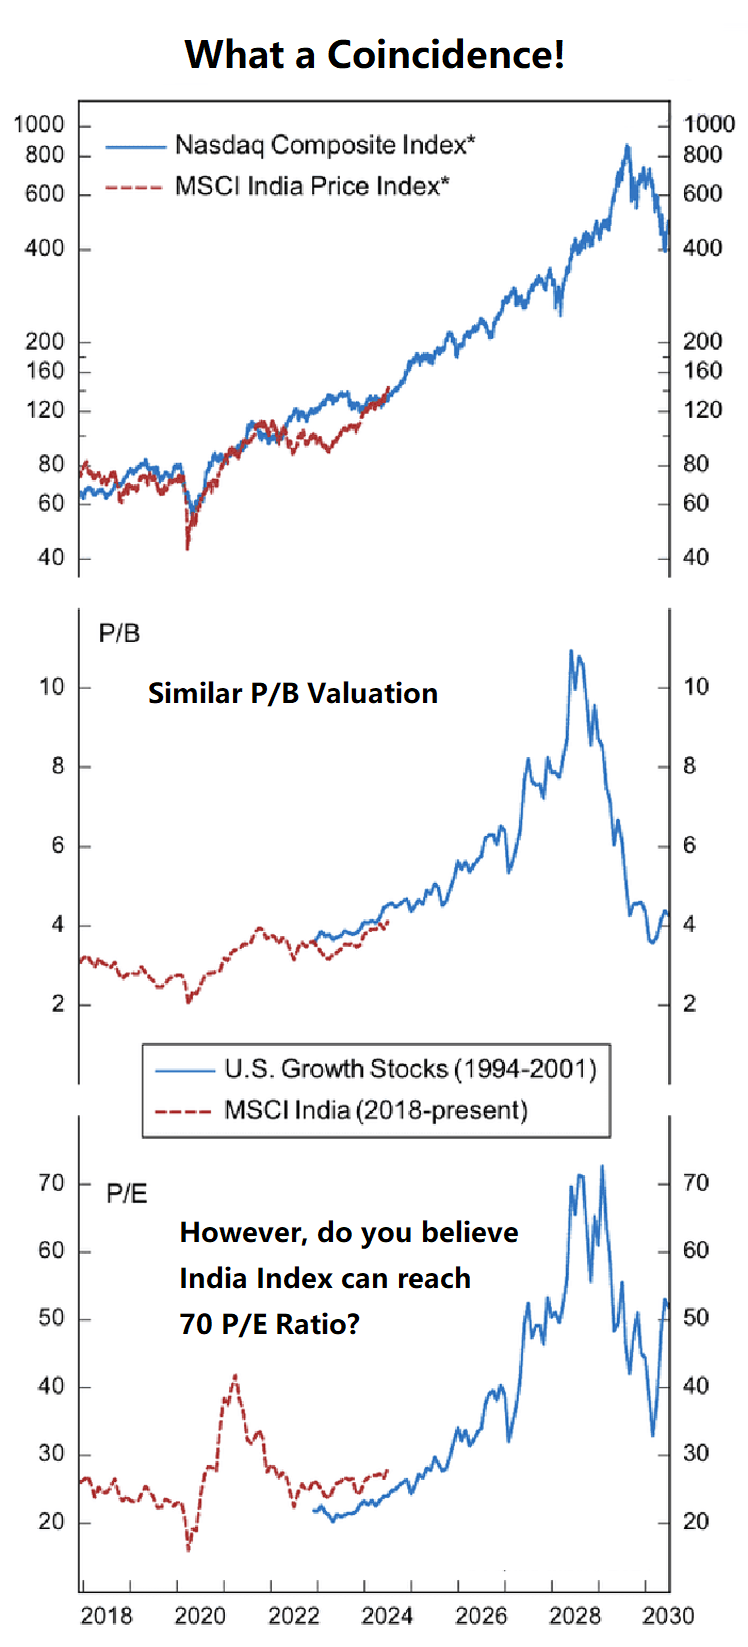
Hold on! During the internet bubble peak, the NASDAQ index's PE (price-to-earnings) valuation once exceeded 70 times, which is quite challenging for the Indian stock market to achieve.
Additionally, data from the Securities and Exchange Board of India indicates that in August, foreign institutional investors became net sellers of Indian listed stocks, with a net outflow of over $1 billion; year-to-date inflows into Indian stocks amount to $2.6 billion, far below last year's $22 billion. With high valuations, "smart money" isn’t exactly naive!

Comentarios
Aún no hay comentarios