
Visa vs. American Express: Which Stock Has the Better Charge?
The digital payments continue to evolve as global commerce moves toward faster, more secure and more digital-first transaction systems. Factors like cross-border recovery, e-commerce penetration and the emergence of tokenization and alternative payment rails are transforming how payment networks and issuers create value.
Within this evolving ecosystem, Visa Inc. V and American Express Company AXP stand as two dominant yet structurally distinct players in the payments landscape. Both benefit from sustained consumer spending and premiumization trends, but their business strategies are quite different. V primarily acts as a network-focused facilitator, connecting banks, merchants and consumers on a massive scale, while AXPAXP-- combines network, issuing and lending under a closed-loop system.
Let’s dive deep and closely compare the fundamentals of the two stocks to determine which stock is more attractive now.
The Case for Visa
Visa’s core strength lies in its network model, which enables high-margin growth without taking on credit risk. By acting as the intermediary rather than the lender, the company benefits from rising transaction volumes while avoiding balance sheet volatility. This approach has consistently provided solid operating leverage, especially as digital payments are increasingly replacing cash around the world.
Another key advantage is scale. Its network effects are difficult to replicate, with over 175 million merchant locations, nearly 14,500 financial institutions and global acceptance creating a self-reinforcing ecosystem. This positions the company to benefit disproportionately from cross-border recovery, where fees are structurally higher and margins more attractive.
In the first quarter of fiscal 2026, payments volume rose 8% year over year on a constant-dollar basis, along with 11% growth in cross-border volume, supported by strength in e-commerce and travel. Processed transactions increased 9%, signaling sustained engagement across consumer and merchant ecosystems. It beat earnings in each of the past four quarters with an average surprise of 2.1%.
Visa Inc. Price, Consensus and EPS Surprise
Visa Inc. price-consensus-eps-surprise-chart | Visa Inc. Quote
Beyond core payments, VisaV-- is expanding into broader money movement solutions. Segments like Visa Direct and commercial payments are scaling faster than the core, with Visa Direct transactions growing 23% and commercial payments volume increasing 10% year over year on a constant dollar basis in the first quarter. This diversification opens new use cases across B2B and real-time transfers. At the same time, it is deepening its role as a payments technology layer through tokenization, value-added services and infrastructure investments. Value-added services revenues surged 28% in constant dollars and ongoing investments in issuer processing and on-chain capabilities position Visa as a broader payments infrastructure provider.
Also, V’s strong cash position enables substantial share buybacks and dividend payouts and supports inorganic growth and financial stability. With $14.8 billion in cash, the company maintains a solid capital position. Its long-term debt-to-capital of 33.6% is lower than the industry’s average of 37.8% and AXP’s 62.8%. Visa returned $5.1 billion to its shareholders through share repurchases and dividends in the fiscal first quarter.
However, escalating operating expenses and higher rebates and client incentives will likely impact its growth potential. In the first quarter of fiscal 2026, adjusted operating expenses rose 16% year over year due to higher marketing costs, general and administrative costs, professional fees and litigation provisions.
The Case for American Express
American Express continues to operate a differentiated closed-loop model centered on premium customers, where higher spend per user drives both transaction revenues and fee income. This positioning allows AXP to focus on spend quality and engagement rather than pure volume growth, creating a structurally different earnings profile versus network peers.
In the fourth quarter of 2025, spending grew 8% year over year with strength across key categories like retail, dining, travel and entertainment, while revenues net of interest expense increased 10.6% in the quarter. Net card fees remained a major driver, growing at a double-digit pace and reaching record levels, supported by product refreshes, a higher mix of fee-paying cards and strong retention rates. Continued investment in lounges, partnerships and experiences reinforces engagement, enabling pricing power and recurring revenue visibility.
At the same time, AXP is expanding its long-term growth base through younger customer acquisition and international markets. Millennials and Gen Z now account for the largest share of U.S. spending, while international spend grew 12% year over year in the fourth quarter, indicating broad-based momentum. This combination extends customer lifetime value and supports sustained growth beyond mature U.S. segments.
The company is balancing growth with disciplined credit and continued investment in technology. Ongoing investments in data, AI and digital platforms aim to enhance personalization, improve efficiency and support long-term operating leverage, with management guiding for 9-10% revenue growth in 2026. It beat earnings in three of the past four quarters and missed once, with an average surprise of 3.9%.
American Express Company Price, Consensus and EPS Surprise
American Express Company price-consensus-eps-surprise-chart | American Express Company Quote
As of Dec. 31, 2025, the company had $47.8 billion in cash and cash equivalents against just $1.4 billion in short-term debt. AXP returned $7.9 billion to its shareholders in 2024 and $7.6 billion in 2025 through dividends and buybacks. In March 2026, it raised its quarterly dividend by 16% to 95 cents per share. However, its dividend yield of 0.8% is lower than Visa’s 0.9%.
However, total expenses increased as a share of revenues to 73.6% in 2025 from 72.6% in 2024, reflecting higher customer engagement and rewards-related spending. Reward and cardmember service costs account for nearly 46% of total expenses in 2025, driven by elevated travel benefits and premium card perks tied to higher billed business.
How Do Estimates Compare for V & AXP?
The consensus estimates for V’s fiscal 2026 earnings indicate an 11.9% increase from a year ago, while the same for revenues suggests 11.3% growth. It has witnessed 10 positive earnings estimate revisions over the past 60 days against three downward revisions.
The Zacks Consensus Estimate for AXP’s 2026 EPS indicates 13.8% year-over-year growth, and the same for revenues signals a 9% rise. It has witnessed four positive earnings estimate revisions over the past 60 days against two downward revisions.
Valuation: V vs. AXP
Visa trades at a premium forward price-to-earnings multiple relative to AmExAXP--, reflecting its capital-light structure and lower risk profile. V currently trades at a forward P/E of 22.63X, higher than AXP’s 16.65X. The valuation gap underscores the market’s preference for Visa’s stability and diversified growth drivers.
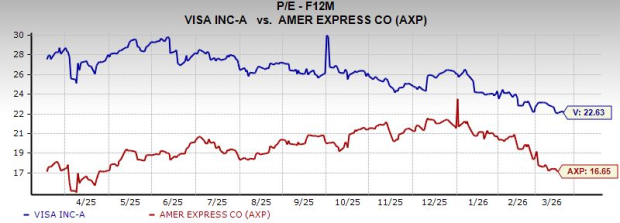
Image Source: Zacks Investment Research
Price Target
Visa currently trades below its average analyst price target of $403.17, implying a 30% potential upside from current levels. AXP also trades below its average analyst price target of $375.89, implying an attractive 26.1% potential upside from current levels.
Price Performance Comparison
In the year-to-date period, Visa has shed less value than American ExpressAXP--. The S&P 500 has decreased 2.3% during this time.
YTD Price Performance – V, AXP & S&P 500
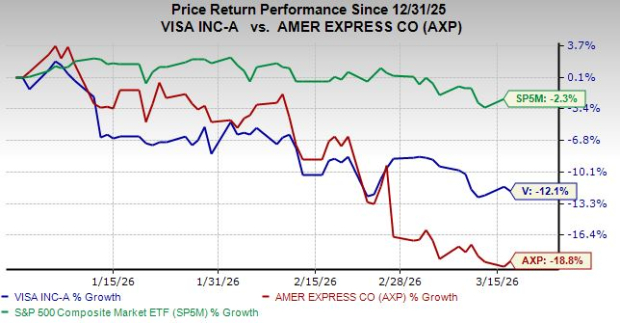
Image Source: Zacks Investment Research
Conclusion
Both V and AXP bring distinct strengths to the digital payments ecosystem. Visa offers a more resilient, capital-light model with consistent volume-driven growth, limited credit exposure and expanding capabilities in tokenization and real-time payments, supporting steady margins and scalability despite a premium valuation, while American Express benefits from strong fee growth and premium customer engagement but carries higher credit sensitivity and rising rewards costs.
As such, V appears to have a better hand at the moment, even though both companies currently carry a Zacks Rank #3 (Hold). You can see the complete list of today’s Zacks #1 Rank (Strong Buy) stocks here.
Free Report: Profiting from the 2nd Wave of AI Explosion
The next phase of the AI explosion is poised to create significant wealth for investors, especially those who get in early. It will add literally trillion of dollars to the economy and revolutionize nearly every part of our lives.
Investors who bought shares like Nvidia at the right time have had a shot at huge gains.
But the rocket ride in the "first wave" of AI stocks may soon come to an end. The sharp upward trajectory of these stocks will begin to level off, leaving exponential growth to a new wave of cutting-edge companies.
Zacks' AI Boom 2.0: The Second Wave report reveals 4 under-the-radar companies that may soon be shining stars of AI’s next leap forward.
Access AI Boom 2.0 now, absolutely free >>Want the latest recommendations from Zacks Investment Research? Today, you can download 7 Best Stocks for the Next 30 Days. Click to get this free report
Visa Inc. (V): Free Stock Analysis Report
American Express Company (AXP): Free Stock Analysis Report
This article originally published on Zacks Investment Research (zacks.com).

Comentarios
Aún no hay comentarios