
VeChain (VET) Loses Bullish Fractal: Technical Breakdown and On-Chain Sentiment Shifts
VeChain (VET), a blockchain platform with a focus on enterprise solutions and supply chain management, has recently experienced a critical shift in its price dynamics. The token's loss of a bullish fractal pattern-a technical signal often associated with trend reversals-has raised questions about its near-term trajectory. This analysis delves into the technical breakdown of VET's price action, on-chain sentiment shifts, and the implications for investors navigating this volatile market.
Technical Breakdown: Fractal Loss and Bearish Momentum
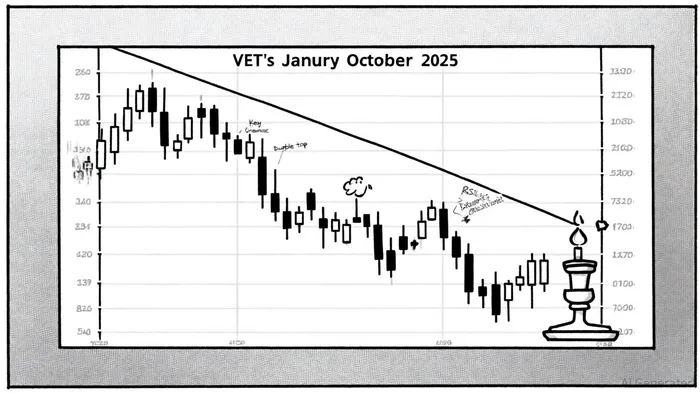
VeChain's price action in 2025 has been marked by a prolonged downtrend, punctuated by intermittent attempts at bullish reversals. However, the recent loss of a bullish fractal pattern-a key technical indicator-has reinforced bearish momentum. According to a Timestabloid report, VETVET-- has breached critical support levels, including $0.025 and $0.0237, trading at $0.01987 as of October 2025. This breakdown is supported by a descending channel on daily and 4-hour timeframes, with lower highs and failed rejections at the channel's upper trendline.
A double top pattern formed around $0.025 in late March 2025 further confirmed the bearish bias, with the neckline at $0.0215 acting as a psychological barrier. Shorter timeframes, such as 1-hour and 15-minute charts, show bearish flag patterns and micro-consolidations, all reinforcing the continuation of the downtrend. Technical indicators like Bollinger Bands, MACD, and RSI also align with this bearish narrative: price hovers near the lower band, MACD lines slope downward, and RSI levels remain below 40 without bullish divergence.
While some analysts, including those at Coinedition, have highlighted potential short-term bullish setups-such as a breakout from a descending triangle, which a Market Periodical article projects could target $0.075-these optimistic projections contrast sharply with the deteriorating technical structure. The immediate bearish outlook is further underscored by volume analysis, where red candles dominate and green volume remains subdued.
On-Chain Sentiment: Mixed Signals Amid Network Upgrades
On-chain metrics provide a nuanced view of VET's ecosystem. The Q2 2025 Messari report reveals a decline in average daily active addresses (down 2.6% to 33,900) and transaction clauses (down 41.4% to 279,800), signaling reduced user interaction. This aligns with a broader 5.3% quarterly drop in VET's market cap to $1.8 billion and a 14.1% decline in VTHO's price.
The Network Value to Transactions (NVT) ratio-a metric that compares market cap to on-chain transaction volume-has also shown mixed signals. While VTHO-based fees increased by 9.2% in Q2 2025, USD-denominated fee generation fell to $14,700, reflecting the token's price drop. This decoupling highlights the challenges VeChainVET-- faces in translating protocol upgrades into tangible on-chain value.
However, the Renaissance Upgrade, including the Galactica phase and dynamic fee mechanisms, has introduced structural improvements. The StarGate staking platform, for instance, incentivizes long-term holders with yield rewards, potentially stabilizing the token's supply dynamics. Additionally, cross-chain partnerships, such as the WanchainWAN-- Bridge integration, aim to expand VET's utility by connecting it to 42 other blockchain networks.
Accumulation/Reversal Dynamics and Investor Behavior
Accumulation patterns in Q2 2025 suggest a cautious buildup in VET's price. According to a BitgetApp analysis, VET is consolidating within a descending triangle near its 100 and 200-day moving averages-a fractal structure historically associated with bullish breakouts. If the price reclaims these moving averages, it could mirror previous fractal breakouts seen in late 2023 and 2024, potentially triggering a rally.
On-chain activity also hints at a shift in investor behavior. Derivatives metrics from The Market Periodical show a 13.33% rise in open interest and a 103.71% surge in on-chain volume, signaling increased demand. Meanwhile, the launch of VeChain's StellaALPHA-- Pay x $B3TR payment card and partnerships with 4ocean for sustainability initiatives underscore the project's real-world utility.
Investment Outlook: Balancing Bearish and Bullish Catalysts
The immediate technical outlook for VET remains bearish, with key support levels at $0.018 and $0.0160 under threat. However, long-term fundamentals-such as enterprise partnerships with DHL, BMW, and Walmart, and the Renaissance Upgrade-provide a foundation for potential recovery. Analysts like Michaël van de Poppe have identified accumulation phases around $0.0135 to $0.0153, projecting Fibonacci targets as high as $0.12 in a bullish cycle, according to a Coinedition analysis.
For investors, the path forward hinges on VET's ability to retest and hold above critical resistance levels. A decisive breakout above $0.025 could reignite bullish momentum, while a sustained breakdown below $0.0160 would likely extend the downtrend. Given the mixed signals in technical and on-chain data, a cautious approach is warranted, with stop-loss orders placed below key support levels.
Conclusion
VeChain's loss of a bullish fractal pattern in 2025 has intensified bearish pressure, but the project's real-world utility and protocol upgrades offer a counterbalance. While on-chain metrics like NVT and transfer volume remain mixed, accumulation dynamics and strategic partnerships suggest a potential for recovery. Investors must remain vigilant, monitoring key technical levels and on-chain sentiment shifts to navigate this complex market.


Comentarios
Aún no hay comentarios