
Vanguard Energy ETF Surpasses 200-Day Moving Average, Shares Rise 2.4%
PorAinvest
martes, 8 de julio de 2025, 6:24 pm ET1 min de lectura
BTC--
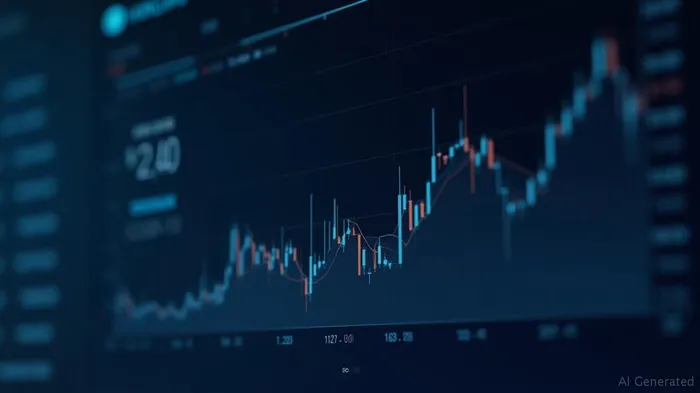
The 52-week low for VDE is $103.065, while the 52-week high is $137.41. This performance highlights a positive trend for the energy sector, which has been buoyed by increased demand and favorable market conditions. The cross above the 200-day moving average suggests a potential bullish signal, indicating that the ETF may continue to perform well in the near future.
Analysts have attributed this upward movement to several factors, including a rebound in energy prices and increased investor confidence in the sector. Additionally, the energy infrastructure ETF has been gaining traction, with investors seeking exposure to a diversified portfolio of energy companies. The recent performance of VDE shares aligns with this trend, as it has shown resilience and growth despite market volatility.
The 200-day moving average is a widely used technical indicator that helps investors gauge the overall trend of a security. A cross above this moving average can signal a potential shift in the market sentiment, encouraging investors to consider the ETF as a promising addition to their portfolios.
Investors should monitor VDE closely, as the ETF's performance could be influenced by various factors, including geopolitical events, regulatory changes, and macroeconomic conditions. However, the recent positive performance and the bullish signal provided by the 200-day moving average suggest that VDE may continue to be a strong performer in the energy sector.
References:
[1] https://bravenewcoin.com/insights/blackrocks-bitcoin-etf-now-out-earns-its-flagship-sp-500-fund
[2] https://www.nasdaq.com/articles/notable-two-hundred-day-moving-average-cross-mlpx-0
VDE--
Vanguard Energy (VDE) shares crossed above their 200-day moving average of $123.29, reaching $124.60 per share. The ETF is currently trading up 2.4% on the day. The chart shows the one-year performance of VDE shares compared to its 200-day moving average. The 52-week low is $103.065, and the 52-week high is $137.41.
In a notable development, Vanguard Energy (VDE) shares crossed above their 200-day moving average of $123.29, reaching $124.60 per share on July 2, 2025. This marks a significant milestone for the ETF, which is currently trading up 2.4% on the day. The chart below illustrates the one-year performance of VDE shares compared to its 200-day moving average.The 52-week low for VDE is $103.065, while the 52-week high is $137.41. This performance highlights a positive trend for the energy sector, which has been buoyed by increased demand and favorable market conditions. The cross above the 200-day moving average suggests a potential bullish signal, indicating that the ETF may continue to perform well in the near future.
Analysts have attributed this upward movement to several factors, including a rebound in energy prices and increased investor confidence in the sector. Additionally, the energy infrastructure ETF has been gaining traction, with investors seeking exposure to a diversified portfolio of energy companies. The recent performance of VDE shares aligns with this trend, as it has shown resilience and growth despite market volatility.
The 200-day moving average is a widely used technical indicator that helps investors gauge the overall trend of a security. A cross above this moving average can signal a potential shift in the market sentiment, encouraging investors to consider the ETF as a promising addition to their portfolios.
Investors should monitor VDE closely, as the ETF's performance could be influenced by various factors, including geopolitical events, regulatory changes, and macroeconomic conditions. However, the recent positive performance and the bullish signal provided by the 200-day moving average suggest that VDE may continue to be a strong performer in the energy sector.
References:
[1] https://bravenewcoin.com/insights/blackrocks-bitcoin-etf-now-out-earns-its-flagship-sp-500-fund
[2] https://www.nasdaq.com/articles/notable-two-hundred-day-moving-average-cross-mlpx-0
Divulgación editorial y transparencia de la IA: Ainvest News utiliza tecnología avanzada de Modelos de Lenguaje Largo (LLM) para sintetizar y analizar datos de mercado en tiempo real. Para garantizar los más altos estándares de integridad, cada artículo se somete a un riguroso proceso de verificación con participación humana.
Mientras la IA asiste en el procesamiento de datos y la redacción inicial, un miembro editorial profesional de Ainvest revisa, verifica y aprueba de forma independiente todo el contenido para garantizar su precisión y cumplimiento con los estándares editoriales de Ainvest Fintech Inc. Esta supervisión humana está diseñada para mitigar las alucinaciones de la IA y garantizar el contexto financiero.
Advertencia sobre inversiones: Este contenido se proporciona únicamente con fines informativos y no constituye asesoramiento profesional de inversión, legal o financiero. Los mercados conllevan riesgos inherentes. Se recomienda a los usuarios que realicen una investigación independiente o consulten a un asesor financiero certificado antes de tomar cualquier decisión. Ainvest Fintech Inc. se exime de toda responsabilidad por las acciones tomadas con base en esta información. ¿Encontró un error? Reportar un problema

SOBRE NOSOTROS
Nuestra historiaAutores de noticiasBase de conocimientosPolítica de privacidadTérmino de usoDescargo de responsabilidad de corretaje de tercerosTérminos de uso de AIMEDivulgaciones de riesgos de AInvest AICarrerasCONTÁCTENOS
Email: support@ainvest.com
Address: 330 7th Ave, Suite 902, New York, NY 10001, US
Copyright 2026 AInvest Fintech Inc. All rights reserved.
Comentarios
Aún no hay comentarios