
Unraveling Pasithea’s Sharp Intraday Drop: A Technical and Market Flow Deep Dive
A Sudden Drop Without a Clear Catalyst
Pasithea (KTTA.O) experienced a sharp intraday drop of nearly 28% today, with a trading volume of 1.07 million shares. The stock moved against a backdrop of no significant fundamental news, prompting a closer look at technical patterns, market flow, and peer stock activity to uncover the underlying cause.
Technical Signals: Bearish Momentum Intensifies
The key technical signal that triggered today was the KD J Death Cross, where the J line crossed below the K line in the stochastic oscillator, typically signaling a bearish momentum shift. This is a warning sign for short-term traders and could indicate a continuation of a downtrend.
Additionally, RSI hit the "oversold" territory, but this usually signals a potential bounce rather than a continued drop. However, in some volatile or highly leveraged stocks, an oversold RSI can sometimes be misleading if selling pressure is still intact.
Notably, no other major reversal or continuation patterns—such as head and shoulders, double top, or double bottom—were confirmed, suggesting the move is more likely driven by momentum rather than a structural reversal.
No Block Trading, But High Sell Pressure
There was no block trading activity reported for KTTAKTTA--.O today, but the absence of buying interest at key levels suggests aggressive selling or profit-taking from longs. While bid/ask clusters aren’t available, the sheer size of the price drop implies a net outflow of liquidity, especially at lower price levels as buyers failed to step in.
The lack of strong support at recent lows allowed the price to drop rapidly, indicating either a loss of confidence or a sudden unwinding of short-term bullish positions.
Peer Stocks: Mixed Signals
Related theme stocks showed mixed performance. Several large-cap stocks like AAP, AXL, and ALSN rose between 1.1% and 1.8%, suggesting broader market optimism. However, a few smaller or more speculative plays like ATXG and AREB moved lower, hinting at some sector rotation or selective underperformance.
This divergence suggests the move in KTTA.O may not be part of a broad sector selloff, but rather a more isolated or liquidity-driven event—possibly due to short-covering, a large short squeeze reversal, or a loss of institutional conviction.
Hypothesis: Short-Term Bearish Sentiment Intensifies
The most plausible explanation for KTTA.O's drop is intensified bearish momentum, supported by the KDJ death cross and RSI entering oversold territory. These signals often precede a continuation of a downtrend, especially in a stock with a small market cap (just under $3.5 million) that can be more susceptible to rapid shifts in sentiment.
Given the lack of block trades or institutional buying, it’s likely that retail selling pressure or algorithmic short-term bearish triggers contributed to the sharp decline. The absence of any bullish reversal patterns also suggests that the drop is not a bottoming process, but a continuation of a downward move.
Another angle is profit-taking or short-covering after a recent rally, though there’s no clear indication of such a rally in recent days. Still, in a volatile, low-volume micro-cap stock like PasitheaKTTA--, even a minor shift in sentiment can lead to sharp moves.
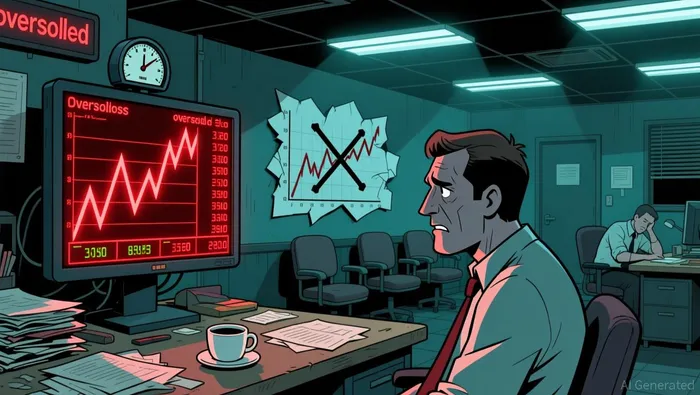
Visual Insight

Comentarios
Aún no hay comentarios