
UAMY.A Sharp Intraday Drop: A Technical and Sectoral Deep Dive
What Happened to UAMY.A Today
United States Antimony (UAMY.A) experienced a sharp intraday drop of -9.33% today, trading on unusually high volume of 3.56 million shares. Despite the dramatic move, there has been no major fundamental news reported. The stock's technical indicators and the behavior of related theme stocks offer valuable insights into the potential drivers behind this sudden drop.
Technical Signal Analysis
Several technical indicators provided mixed signals today. The double bottom pattern was confirmed, suggesting a potential reversal from a downtrend. However, the KDJ death cross signaled a bearish momentum shift, reinforcing a short-term weakening in the stock's price action. Meanwhile, other key indicators like RSI, MACD, and the head-and-shoulders patterns did not trigger, leaving the double bottom and KDJ death cross as the most relevant signals.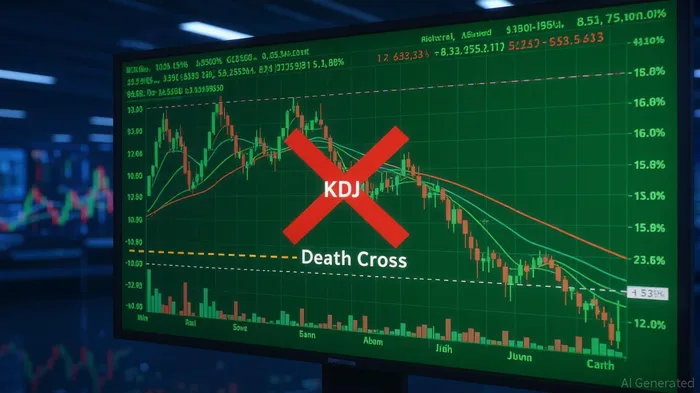
The confirmation of the double bottom pattern may have attracted some technical buyers, but the KDJ death cross likely triggered a wave of selling pressure from traders who view this as a signal to exit positions or short the stock.
Order-Flow Breakdown
Unfortunately, there is no block trading data available to confirm specific institutional activity. However, the massive volume spike suggests there was significant selling pressure. The absence of a clear bid cluster and the lack of net inflow data point to the possibility of market order selling — possibly from stop-loss triggers or algorithmic trading reacting to the KDJ death cross.
Peer Comparison and Sector Rotation
The broader market saw mixed performances. While some high-profile stocks like AAPL and BH.A posted gains, others like BEEM and AACG saw significant losses. UAMY.A’s sharp drop was not mirrored across all theme stocks, indicating that the move may not be sector-wide but rather stock-specific.
The divergence in performance between UAMY.A and its peers suggests that the sell-off was likely driven by internal factors such as a reversal signal from the KDJ indicator or possible short-covering activity rather than an industry-wide correction.
Hypothesis Formation
Based on the data, two primary hypotheses emerge:
- Algorithmic Triggering: The KDJ death cross may have activated automated trading systems or stop-loss orders, leading to a cascading sell-off.
- Technical Reversal Confirmed and Shortened: The double bottom pattern was confirmed, but traders may have taken profits early, especially after the KDJ death cross signaled weakening momentum.
These factors likely converged to create the unusual intraday move.


Comentarios
Aún no hay comentarios