
Trump Media & Technology Group (DJT): A Technical Deep Dive into Breakout Potential and Support Rebound
In the volatile world of speculative stocks, Trump MediaDJT-- & Technology Group (DJT) has emerged as a case study in technical intrigue. As of September 19, 2025, the stock trades at $17.44, up 3.01% from the prior day, but down 48.86% year-to-date [4]. For traders and investors, the question isn't just about the company's fundamentals—it's about whether the stock is poised for a breakout after a recent rebound from critical support levels.
The Technical Landscape: A Mixed Bag of Signals
DJT's technical indicators paint a nuanced picture. The 14-day RSI sits at 50.46, hovering near neutrality [2], while the MACD (-0.19) signals a bearish bias [1]. The 20-day exponential moving average (EMA) at $17.29 suggests a potential buy signal, as the current price ($17.44) trades slightly above it. However, the 50-day EMA ($17.73) and 200-day EMA ($24.03) remain above the current price, reinforcing a sell signal [3]. This divergence highlights the stock's precarious position between short-term optimism and long-term skepticism.
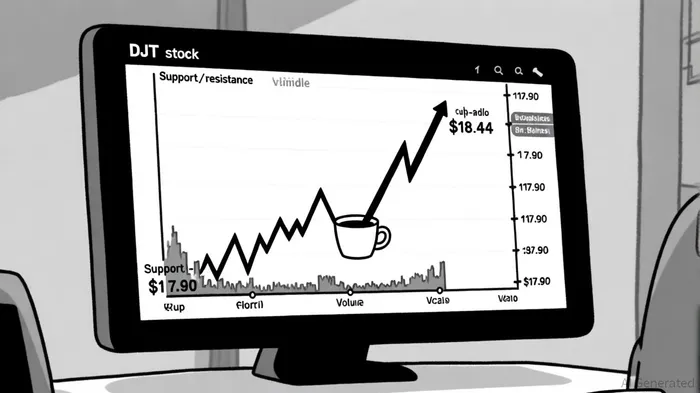
Support and Resistance: The Battle for $17.44
Key support levels for DJT have been tested recently. The $16.25–$16.49 range has acted as a floor, with volume surging on September 19 to 18.8 million shares as the stock rebounded from $16.92 to $17.43 [4]. Classic pivot points suggest additional support at $15.84 and $16.29 [3], while resistance clusters at $17.37, $17.82, and $18.15 [2]. The stock's recent test of the $17.10 support zone—successfully defended—has triggered a rebound to $17.41, setting the stage for a potential push toward $17.45–$17.50 [4].
Breakout Patterns: Cup-and-Handle and Falling Wedge
The most compelling technical narrative centers on two patterns. First, a cup-and-handle formation has emerged, with a confirmed breakout above the $18.44 resistance level. Analysts on TradingView project price targets of $19.00 and $19.84 if the pattern holds [1]. Second, a falling wedge near $17.90 suggests a short-term reversal, with a target of $18.71 and a stop-loss at $17.60 [1]. Both patterns are validated by surging volume, particularly on September 19, when trading activity spiked to 18.8 million shares [4].
Fundamental Catalysts: Share Buybacks and Market Sentiment
While technicals dominate the near-term outlook, fundamentals are not entirely absent. DJT's recent $400 million share repurchase plan—funded by its $2.09 billion cash reserve—signals management's confidence in the stock's intrinsic value [1]. This move could compress the float and potentially drive the stock higher, especially if short sellers cover their positions. However, the company's net loss of $19.98M in the last quarter and a beta of 4.71 (indicating extreme volatility) underscore the risks [4].
The Path Forward: Caution and Opportunity
For traders, the key question is whether DJT can sustain its momentum above $17.45. A breakout above $18.44 would validate the cup-and-handle pattern and open the door to $19.00. Conversely, a retest of the $16.25 support level could trigger a deeper correction. The RSI's neutral reading and the absence of overbought conditions (RSI < 70) suggest the stock isn't yet overextended, offering a balanced entry point for risk-tolerant investors [2].
Conclusion: A High-Risk, High-Reward Proposition
DJT remains a speculative play, driven by technical patterns and market sentiment rather than earnings. While the $400 million buyback and volume-confirmed breakouts are encouraging, the stock's high beta and potential for dilution demand caution. For those willing to navigate the volatility, the coming weeks could offer a rare opportunity to capitalize on a stock at the intersection of technical optimism and institutional confidence.

Comentarios
Aún no hay comentarios