
The U.S. Trade Gap Contraction: A Catalyst for Commodity and Export-Driven Sectors?
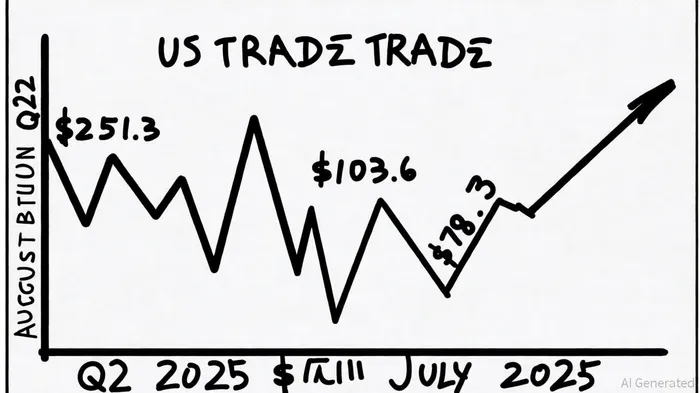
The U.S. trade deficit has exhibited a paradoxical trajectory in 2025, oscillating between contraction and expansion amid shifting global demand and policy interventions. While the second quarter saw a historic 42.9% narrowing of the current-account deficit to $251.3 billion, driven by a $11.3 billion surge in goods exports and an $184.5 billion drop in imports [1], the subsequent months of July and August witnessed a sharp rebound. By August, the goods trade deficit had widened to $78.3 billion—a $18.1 billion increase from July—due to a 5.4% rise in imports and a 1.8% decline in exports [3]. This volatility raises critical questions for investors: Can the Q2 contraction signal a sustainable shift in trade dynamics, or is it a temporary anomaly? How should capital be allocated across sectors to capitalize on—or mitigate risks from—these fluctuations?
Strategic Sector Rotation: Winners and Losers in a Shifting Trade Landscape
The interplay between trade deficits and sector performance hinges on two key factors: global demand for U.S. exports and domestic import dependency. Q2's contraction offers a blueprint for identifying sectors poised to benefit from a narrowing trade gap, while the July-August rebound underscores vulnerabilities.
1. Capital Goods and Industrial Supplies: Export-Driven Resilience
The Q2 data reveals a $708.840 billion export value for capital goods (excluding automotive), alongside a $146.822 billion surge in civilian aircraft, engines, and parts [1]. These figures highlight the strength of U.S. manufacturing in high-value, export-oriented industries. The Trump administration's 10% baseline tariffs on imports have also indirectly bolstered domestic producers by making foreign alternatives more expensive [3]. For investors, this suggests an overweights position in sectors like aerospace, industrial machinery, and advanced manufacturing, which are insulated from global supply chain shocks and benefit from export growth.
2. Agriculture: A Tale of Two Markets
U.S. agricultural exports face a dual challenge. While the Q2 trade deficit contraction was partly fueled by reduced imports, the sector's own exports are projected to decline to $169.5 billion in 2025 due to falling soybean and corn prices, strong competition from Brazil, and a stronger dollar [1]. However, niche opportunities persist. For instance, demand for ethanol and horticultural products in Canada and Mexico remains robust, while emerging markets in Southeast Asia and Africa offer untapped potential [1]. A strategic rotation here would involve hedging against currency risks and focusing on diversified agribusiness firms with access to stable regional markets.
3. Services and Energy: The Offset to Goods Deficits
Services exports rose to $301.6 billion in Q2, partially offsetting the goods deficit [1]. This trend is critical for investors in sectors like tourism, education, and digital services, which are less sensitive to trade policy. Conversely, energy imports surged in July and August, driven by weak global demand for U.S. oil and gas [3]. Energy producers may need to pivot toward cost-cutting and renewable energy investments to remain competitive.
Navigating Risks: Tariffs, the Dollar, and Global Demand
The Trump administration's tariff policies have created a double-edged sword. While they protect domestic industries, they also risk retaliatory measures from trade partners like China, Mexico, and Vietnam [3]. Additionally, a stronger U.S. dollar—up 8.7% against the yuan in Q2—continues to erode export competitiveness [1]. Investors must balance these risks by favoring sectors with pricing power (e.g., technology and pharmaceuticals) and avoiding those reliant on price-sensitive global markets (e.g., textiles).
Conclusion: A Dynamic Framework for Sector Rotation
The U.S. trade deficit's Q2 contraction was a fleeting reprieve, not a structural shift. For now, investors should adopt a barbell strategy: overweighting export-driven sectors like capital goods and services while underweighting import-dependent industries such as agriculture and energy. However, the July-August rebound underscores the need for agility. As global demand patterns evolve and trade policies shift, continuous monitoring of import/export data—particularly sector-specific trends—will be essential to recalibrate portfolios.
In the coming months, the key question will be whether Q2's export surge is a harbinger of sustained growth or an outlier. For now, the data suggests that strategic sector rotation, anchored to real-time trade dynamics, remains the most prudent path forward.


Comentarios
Aún no hay comentarios