
SUI's Strategic Accumulation and the Case for a Q4 Rebound
Sui (SUI) is at a pivotal inflection point in Q4 2025, where technical indicators, on-chain behavior, and historical parallels to BitcoinBTC-- and EthereumETH-- suggest a compelling case for a rebound toward $5. After a volatile correction in late October 2025-triggered by a large token unlock and cascading liquidations-SUI has stabilized near $2.80, with critical support levels at $2.82 and $2.11 acting as psychological anchors, according to a Coinpedia report. While the immediate bearish narrative dominates, a deeper analysis reveals strategic accumulation patterns and sentiment shifts that could catalyze a retest of the $5 zone by year-end.
Technical Indicators Signal a Transition
SUI's price action in Q4 2025 has been a masterclass in mixed signals. The Relative Strength Index (RSI) currently sits at 43, indicating slight bearish momentum but not yet oversold territory, according to a CoinCentral analysis. However, the MACD histogram is showing signs of waning bearish pressure, with a bullish crossover on the horizon. This divergence between short-term and medium-term indicators is a classic setup for a reversal.
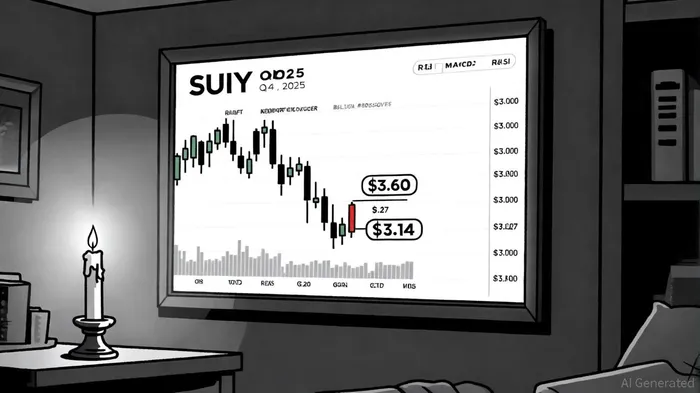
The most compelling technical pattern is the falling wedge forming near $3.60. A breakout above this pattern could propel SUISUI-- toward $4.60 and even $6.34 under stronger momentum, per an FXEmpire forecast. Additionally, SUI remains above its 200-day Simple Moving Average (SMA) at $3.14, a critical long-term bullish trendline, per an OnTheNode analysis. The 50-day SMA crossing above the 200-day SMA-a golden cross-would further validate the upward trajectory, according to a Coinpaper outlook.
Historical backtests of the MACD Golden Cross strategy for SUI reveal mixed outcomes. From 2022 to 2025, a buy-on-golden-cross-and-hold-for-30-days approach yielded an average return of -1.85% per trade, with a total return of -35.64% over the period. While the strategy occasionally produced winning trades (average win of 6.18%), losses averaged -6.18%, resulting in a hit rate that failed to offset drawdowns. The maximum drawdown reached 40.05%, underscoring the volatility of relying solely on this signal, per Coinpaper.
On-Chain Behavior Validates Accumulation
On-chain data paints a bullish picture of growing economic activity. SUI's blockchain has seen $73.85 billion in stablecoin transfers in Q3 2025, surpassing TON's $49.46 billion and signaling robust adoption, according to an OKX analysis. Capital inflows into the network have surged, with $8.74 million in outflows from exchanges suggesting accumulation by long-term holders, per The Currency Analytics.
The price's proximity to the lower Bollinger Band at $3.27 historically indicates a bounce is likely. This is reinforced by the fact that SUI has rebounded sharply from a sharp correction in late October, regaining 11% in a single day, per a Brave New Coin insight. Whale activity has also increased, with large investors stepping in to defend key support levels, according to a CCN analysis.
Historical Parallels to Bitcoin and Ethereum
SUI's trajectory mirrors historical rebounds in Bitcoin and Ethereum, albeit with unique nuances. Bitcoin's four-year halving cycle has traditionally seen sharp corrections followed by explosive rallies, according to a CNBC report. However, 2025's market is less volatile due to institutional adoption and ETF approvals, with corrections now averaging 30–50% instead of 80%. SUI's recent 8% weekly decline and 44% drop in spot volumes to $2.9B reflect a similar shift toward caution but not capitulation, an OKX analysis suggests.
Ethereum's historical rebounds often involve consolidation in ascending channels before breakouts. While Ethereum currently struggles to break above $2,800, SUI's architecture-optimized for high throughput and real-time finality-gives it an edge in DeFi adoption, according to a Levex guide. Recent security upgrades post-Cetus exploit have further bolstered confidence, contrasting with Ethereum's stagnant volume, per an Analytics Insight article.
Contrarian Sentiment and Institutional Tailwinds
Market sentiment for SUI is a contrarian indicator. The weighted sentiment index stands at -0.934, a level historically followed by bullish waves, according to OKX. Meanwhile, institutional adoption is accelerating, with Swiss banks and Grayscale offering custody services for SUI, per OKX. This legitimizes SUI as a viable alternative to Ethereum, particularly for high-performance DeFi applications.
The key risk remains a breakdown below $3.27 or the 200-day SMA at $3.14, which could trigger a decline toward $2.60–$2.63, according to The Currency Analytics. However, the current mix of technical resilience, on-chain strength, and institutional tailwinds suggests buyers will defend these levels.
Positioning for a Q4 Rebound
For investors, the case for SUI hinges on three factors:
1. Technical Breakouts: A golden cross or wedge breakout would validate the $4.20–$5.25 targets.
2. On-Chain Validation: Sustained capital inflows and stablecoin growth indicate a healthy ecosystem.
3. Sentiment Shifts: Contrarian indicators and institutional adoption suggest a broader market rotation into altcoins.
If SUI holds above $3.14 and breaks through $4.33 resistance, it could retest $5 by Q4 2025. While risks remain, the confluence of technical, on-chain, and sentiment factors makes SUI a compelling case for strategic accumulation ahead of a potential rebound.


Comentarios
Aún no hay comentarios