
Stock Sell-Off Echoes 2020 Crash: What Technicals and History Say Next
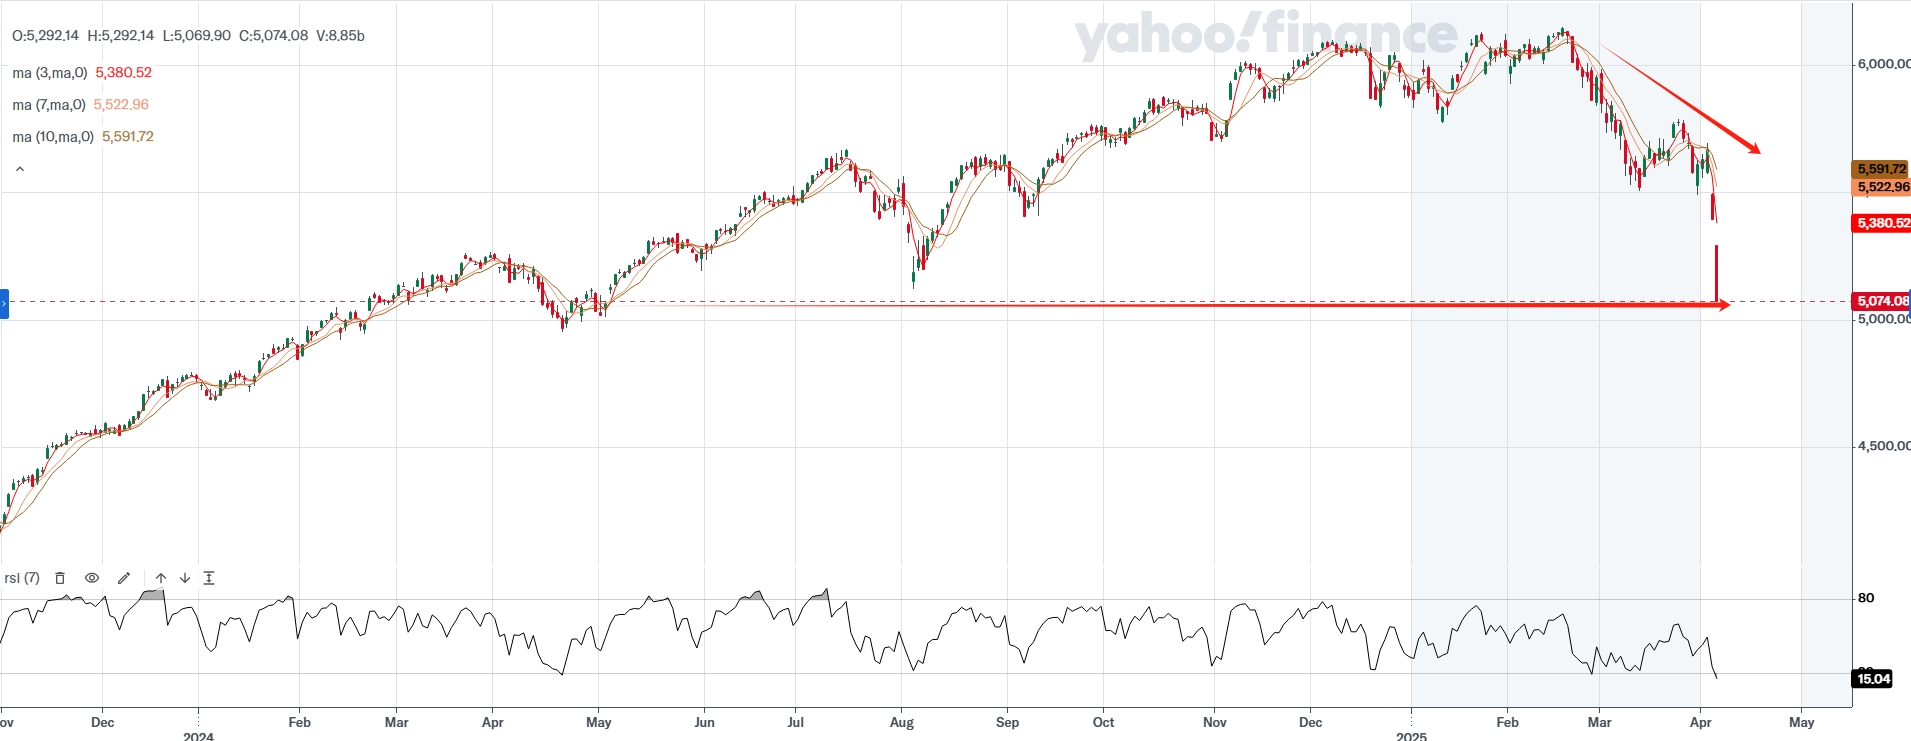
S&P 500 has fallen 18% from the peak as Trump's aggressive worldwide tariff war intensifies, and the bloodied futures market suggests stocks will go through further pain on Monday. The rapid decline and extreme technical bearishness are reminiscent of what happened in March 2020, when the S&P tumbled 35% in a month following the Covid shock and a liquidity crisis, during which the stock market experienced four circuit breakers. Though the triggers are totally different—with this round of selling driven by presidential actions—the past experience and technical analysis are clearly indicating what may come next.
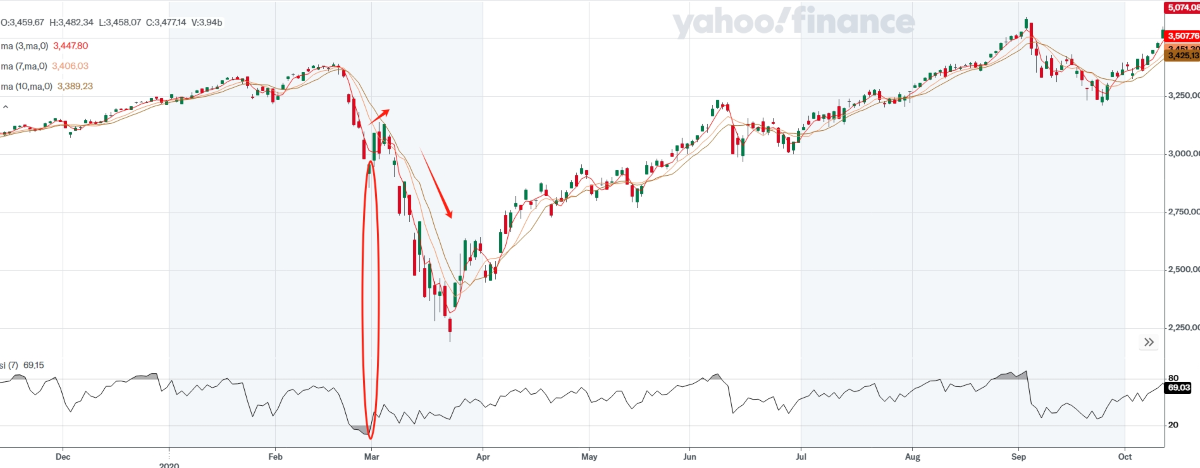
Looking back at 2020, the global economy showed signs of stagflation the prior year. Then came the sudden Covid shock, the Russia-Saudi Arabia oil price war, and the Fed's two emergency rate cuts that slashed interest rates from 1.5% to 0%, sparking fear. Eventually, a liquidity crunch further destroyed the market, leading to the worst single-day percentage drops since the 1987 stock market crash.
Flip the page to now. The U.S. economy is cooling, though still robust, with a stubborn 2.8% core PCE—another stagflation signal. Oil prices are free falling as OPEC+ boosts production, while traders are betting on a 120 bps Fed rate cut this year to avoid a downturn. The situation shares many similarities with 2020—and even the same president! Although investors are selling, they have not yet reached the panic levels seen in 2020 when the VIX spiked to 80.
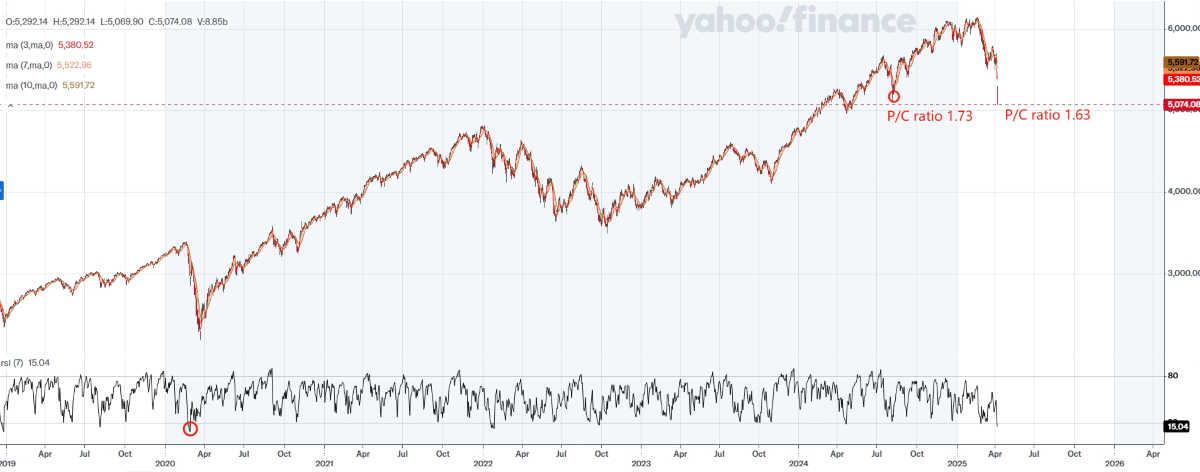
However, investors should be aware that a dead-cat bounce remains plausible. The S&P 500's RSI dropped to 15 based on Friday's close and ready for session lows after Monday's open—levels not seen since 2020—signaling extreme bearish sentiment. Meanwhile, the SPY put/call ratio climbed to 1.63, the highest since August 5, 2024, when the S&P 500 also hit an intraday low before skyrocketing shortly after.
All of that suggests a short-term bounce is possible amid the overwhelming bearish noise and extreme technical signals. However, any rebound may be short-lived, as Trump is likely to continue retaliating with tariffs to achieve his goals (on the deficit, lower rates, etc.), given his relentless reaction to the recent market freefall. Therefore, investors may consider using the interest to buy the dip for speculative purposes—or prepare to resume bearish positions.
2020 gives us the example. When the RSI dropped to as low as 8.13 on February 28th, the broader market began bouncing within a few days, and the RSI returned to normal. However, when MA(3) failed to break MA(10), and eventually the MA(3,7,10) inverted again, the next wave of sell-off arrived, leading to a deeper downturn and new lows, triggering eventual panic and fire sales. Note that during the March 4th to 23rd tumble, RSI fluctuated around 30—so technically, investors weren't panicking, but stocks were completely stressed.
Here's the saying: when consensus is bearish, as shown in technical warnings, a bounce can happen—even if it's a dead-cat bounce—as big funds may leverage it to cash out or build short positions. However, when technicals are no longer bearish and stocks flip trends, it signals a more bearish force forming, potentially making everything worse.
It's quite normal in the market: when everyone feels pessimistic, they rush to cash out, and big funds then push stocks higher to make retail investors rethink the market and believe the worst is over. But when they buy back in, the big funds begin harvesting. Initially, investors may keep buying the dip, but when stocks deteriorate again, they soon realize they were trapped.
Key point to watch:
when MA(3) breaks MA(7) and MA(10), it typically implies a fully bullish pattern. If MA(3) breaks MA(7) but fails to break MA(10), the chart remains bearish and signals a dead-cat bounce. Investors should also watch for another session low; caution is needed, as direction becomes unclear.
Technical analysis can reveal much—reflecting what investors truly think about fundamentals. Here are key things to watch that could further trigger a sell-off:
1. Broad 10% tariffs take effect on Monday, but more manufacturing-targeted tariffs on Asian countries (China, Japan, Vietnam, etc.) start Wednesday, which could spark panic as they officially land;
2. March CPI will be released Thursday, and should include the impact of an additional 20% tariff on China, parts of the 25% tariff on Mexico and Canada, and the 25% tariff on steel and aluminum. A higher-than-expected reading could further worsen the inflation outlook, shaping a stagflation scenario;
3. Trump may further retaliate with tariffs on semiconductors and pharmaceuticals—industries he promised to target but hasn't yet—raising new concerns;
4. Banks release Q1 earnings this week (JPMorgan on Friday), and a gloomy outlook could disappoint investors and raise broader economic concerns.
Unlock Market-Moving Insights.
Subscribe to PRO Articles.
Already have an account? Sign in
Unlock Market-Moving Insights.
Subscribe to PRO Articles.
Already have an account? Sign in


