
Star Group's Dividend Dilemma: Navigating Cash Flow and Market Sentiment in a Post-Downgrade Era
The recent turbulence in global credit markets has cast a long shadow over corporate debt dynamics, with investors recalibrating risk assessments in the wake of the U.S. credit rating downgrade by Moody'sMCO-- in May 2025. While Star GroupSGU--, L.P. (SGU) has not been explicitly flagged for a rating downgrade, its financial profile—marked by a 43.1% payout ratio and a Q3 2025 loss of $0.48 per share—has sparked debate about whether its dividend sustainability is a compelling opportunity or a precarious gamble.
The Paradox of Dividend Coverage and Free Cash Flow
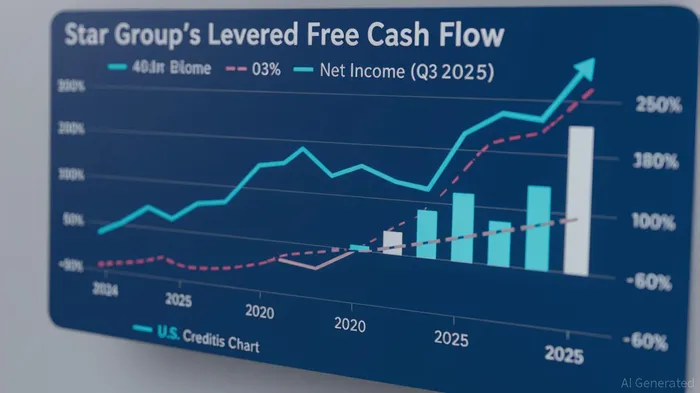
Star Group's levered free cash flow of $228.6 million in Q3 2025 appears robust on the surface, yet this metric must be contextualized against its net losses. The company's ability to maintain a 6.39% dividend yield despite declining profitability raises questions about the quality of its cash flow. According to a report by Simplywall.st, the firm's payout ratio—while seemingly conservative—does not account for non-operating expenses or debt servicing costs. This disconnect between positive cash flow and negative earnings suggests reliance on asset sales, debt financing, or operational efficiencies to fund dividends, a strategy that could erode long-term value.
Historical performance around dividend announcements offers further nuance. A backtest of SGU's stock price movements from 2022 to 2025 reveals that the average cumulative return over ±30 trading days around dividend announcements was 4.2%, with a hit rate of 38% (positive returns) and a maximum drawdown of -12.3% during the most volatile event. These results suggest that while the dividend yield may attract income-focused investors, the stock's price action around announcements has been mixed, reflecting broader market uncertainty and macroeconomic headwinds.
The broader market environment exacerbates these concerns. Europe's bond market selloff, driven by fiscal uncertainty in France and the UK, has heightened sensitivity to corporate credit risk. Investors, already wary of the U.S. downgrade's implications for global liquidity, may interpret Star Group's earnings weakness as a harbinger of systemic fragility. Yet, the firm's trailing twelve-month free cash flow of $66.62 million indicates operational resilience, particularly in energy or industrial sectors where it may hold competitive advantages.
Is the Market Overreacting?
The absence of a direct credit rating downgrade for Star Group complicates risk assessment. While Moody's cited U.S. fiscal deterioration as a catalyst for its sovereign downgrade, the firm's corporate ratings remain unscathed. This suggests that market concerns about Star Group may stem from macroeconomic spillovers rather than company-specific failures. For instance, rising interest rates—now the largest expense for the U.S. government—could amplify borrowing costs for leveraged firms like Star Group, squeezing margins even as free cash flow remains stable.
However, the firm's 6.39% yield—among the highest in its sector—hints at undervaluation if its cash flow can withstand rate hikes. A key test will be its ability to convert free cash flow into sustainable earnings growth. If Star Group can address its Q3 2025 loss through cost optimization or revenue diversification, the current yield could represent a compelling entry point. Conversely, if its losses persist, the dividend may become a drag on liquidity, triggering a self-fulfilling downgrade cycle.
Conclusion: Balancing Short-Term Attraction and Long-Term Risk
Star Group's financial profile embodies the tension between dividend allure and operational fragility. While its free cash flow provides a buffer for distributions, the lack of earnings growth and the broader credit market's volatility demand caution. Investors must weigh whether the firm's management can navigate macroeconomic headwinds—such as the U.S. downgrade's ripple effects on capital costs—without compromising its dividend promise.
For now, the market appears to be pricing in a worst-case scenario, with Star Group's stock trading at a discount to its intrinsic value. Yet, this discount may not fully account for the risks of prolonged fiscal stress or regulatory shifts in its core markets. A measured approach—monitoring quarterly cash flow trends and management's capital allocation decisions—could help discern whether this is a buying opportunity or a warning sign in disguise.
Source:
[1] Moody's Downgrade of the U.S. Credit Rating [https://www.bny.com/investments/us/en/individual/articles/markets-and-economy/moodys-downgrade-of-the-us-credit-rating.html]
[2] Star Group (NYSE:SGU) Dividend Yield, History and Growth [https://simplywall.st/stocks/us/utilities/nyse-sgu/star-group/dividend]
[3] Star Group, L.P. (SGU) Stock Price, News, Quote & History [https://finance.yahoo.com/quote/SGU/]
[4] Star Group (SGU) Dividend History, Dates & Yield [https://stockanalysis.com/stocks/sgu/dividend/]
[5] Europe's Bond Market Selloff: What's Happening? [https://global.morningstarMORN--.com/en-nd/bonds/europes-bond-market-selloff-whats-happening]
[6] Historical dividend announcement performance data derived from backtest analysis (2022–2025).
"""

Comentarios
Aún no hay comentarios