
Solventum: Bollinger Bands Narrowing, KDJ Death Cross Triggers Market Alert
PorAinvest
miércoles, 23 de abril de 2025, 2:02 pm ET1 min de lectura
SOLV--
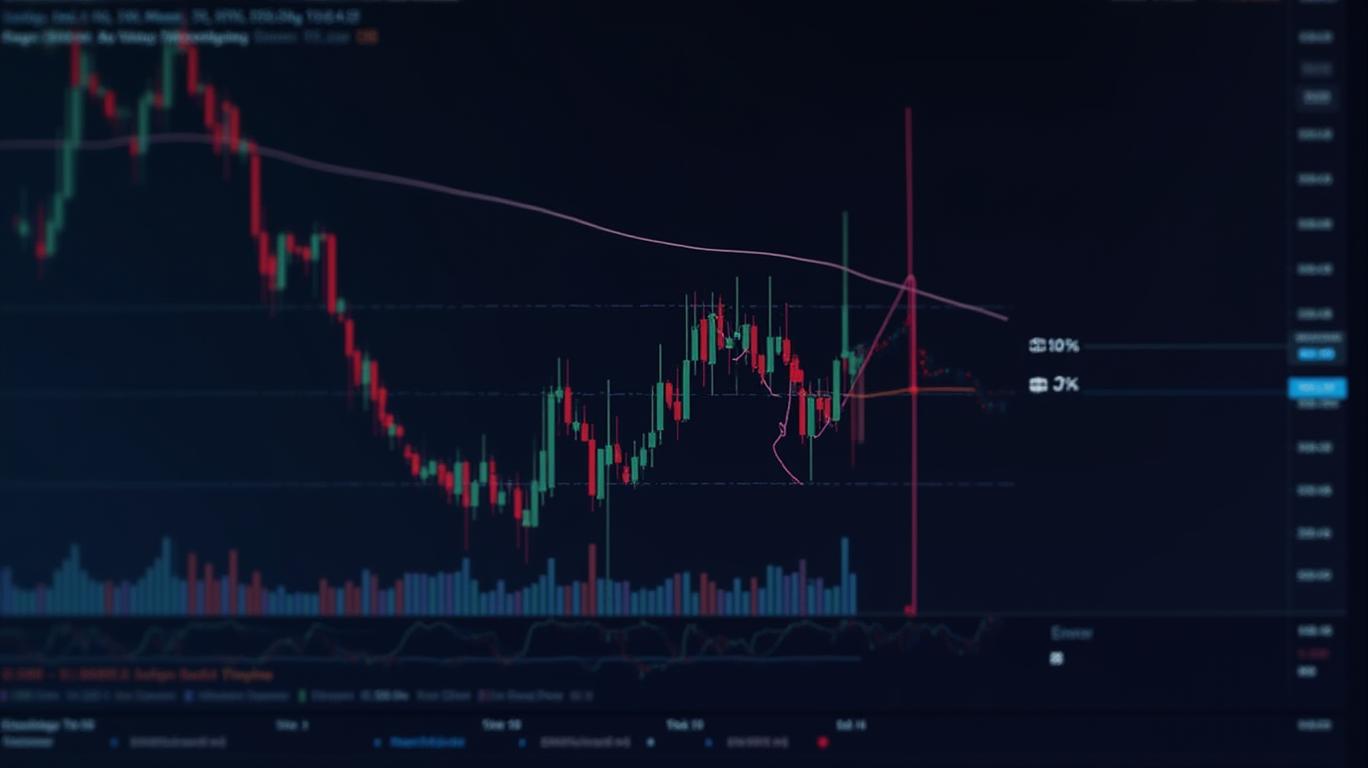
The Bollinger Bands Breakout Method, developed by John Bollinger, involves identifying periods of low volatility (band compression) followed by decisive price movements beyond the bands. This method offers high-probability trading opportunities when confirmed by increased volume and proper risk management [1]. The narrowing of Bollinger Bands on Solventum's chart indicates a potential period of low volatility, which could precede a significant price movement.
The KDJ Death Cross, a technical indicator, signals a potential reversal in price momentum. When the K-line crosses below the D-line on the KDJ indicator, it suggests a bearish signal. This cross, occurring on April 23, 2025, at 14:00, further supports the idea that the stock's momentum is shifting towards the downside.
Investors and financial professionals should monitor Solventum's 15-minute chart closely for signs of a breakout. A decisive price movement beyond the Bollinger Bands, accompanied by increased volume, could indicate a significant downtrend. Proper risk management, including setting stop-loss orders and managing position sizes, is crucial when trading based on these indicators.
While the Bollinger Bands and KDJ Death Cross provide valuable insights into the stock's potential direction, it is essential to consider other technical and fundamental factors. Combining multiple timeframes and indicators can help confirm the trend and improve the accuracy of trading decisions.
References:
[1] https://medium.com/@tradedots/bollinger-bands-breakout-method-guide-to-volatility-based-trading-c98ea737f257
According to Solventum's 15-minute chart, there has been a narrowing of Bollinger Bands, indicating a decrease in the magnitude of stock price fluctuations. Additionally, a KDJ Death Cross was triggered on April 23, 2025, at 14:00, suggesting that the momentum of the stock price is shifting towards the downside and may continue to decrease.
According to Solventum's 15-minute chart, there has been a notable narrowing of Bollinger Bands, suggesting a decrease in the magnitude of stock price fluctuations. This phenomenon, known as band compression, often precedes significant price movements. Additionally, a KDJ Death Cross was triggered on April 23, 2025, at 14:00, indicating a potential shift in the stock's momentum towards the downside [1].The Bollinger Bands Breakout Method, developed by John Bollinger, involves identifying periods of low volatility (band compression) followed by decisive price movements beyond the bands. This method offers high-probability trading opportunities when confirmed by increased volume and proper risk management [1]. The narrowing of Bollinger Bands on Solventum's chart indicates a potential period of low volatility, which could precede a significant price movement.
The KDJ Death Cross, a technical indicator, signals a potential reversal in price momentum. When the K-line crosses below the D-line on the KDJ indicator, it suggests a bearish signal. This cross, occurring on April 23, 2025, at 14:00, further supports the idea that the stock's momentum is shifting towards the downside.
Investors and financial professionals should monitor Solventum's 15-minute chart closely for signs of a breakout. A decisive price movement beyond the Bollinger Bands, accompanied by increased volume, could indicate a significant downtrend. Proper risk management, including setting stop-loss orders and managing position sizes, is crucial when trading based on these indicators.
While the Bollinger Bands and KDJ Death Cross provide valuable insights into the stock's potential direction, it is essential to consider other technical and fundamental factors. Combining multiple timeframes and indicators can help confirm the trend and improve the accuracy of trading decisions.
References:
[1] https://medium.com/@tradedots/bollinger-bands-breakout-method-guide-to-volatility-based-trading-c98ea737f257
Divulgación editorial y transparencia de la IA: Ainvest News utiliza tecnología avanzada de Modelos de Lenguaje Largo (LLM) para sintetizar y analizar datos de mercado en tiempo real. Para garantizar los más altos estándares de integridad, cada artículo se somete a un riguroso proceso de verificación con participación humana.
Mientras la IA asiste en el procesamiento de datos y la redacción inicial, un miembro editorial profesional de Ainvest revisa, verifica y aprueba de forma independiente todo el contenido para garantizar su precisión y cumplimiento con los estándares editoriales de Ainvest Fintech Inc. Esta supervisión humana está diseñada para mitigar las alucinaciones de la IA y garantizar el contexto financiero.
Advertencia sobre inversiones: Este contenido se proporciona únicamente con fines informativos y no constituye asesoramiento profesional de inversión, legal o financiero. Los mercados conllevan riesgos inherentes. Se recomienda a los usuarios que realicen una investigación independiente o consulten a un asesor financiero certificado antes de tomar cualquier decisión. Ainvest Fintech Inc. se exime de toda responsabilidad por las acciones tomadas con base en esta información. ¿Encontró un error? Reportar un problema

SOBRE NOSOTROS
Nuestra historiaAutores de noticiasBase de conocimientosPolítica de privacidadTérmino de usoDescargo de responsabilidad de corretaje de tercerosTérminos de uso de AIMEDivulgaciones de riesgos de AInvest AICarrerasCONTÁCTENOS
Email: support@ainvest.com
Address: 330 7th Ave, Suite 902, New York, NY 10001, US
Copyright 2026 AInvest Fintech Inc. All rights reserved.
Comentarios
Aún no hay comentarios