
Solana's Strategic Path to $295: Breaking $252 as the Ultimate Bullish Signal
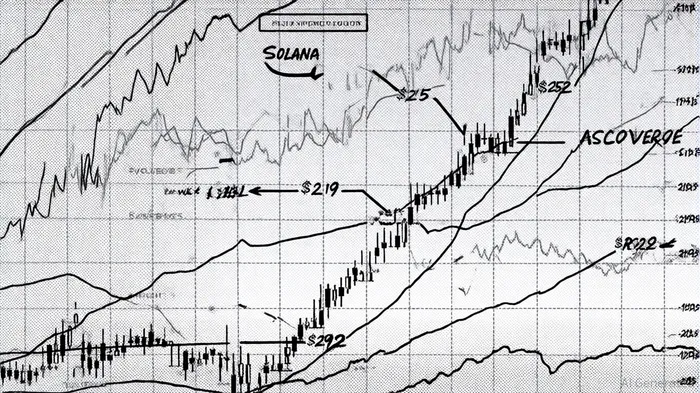
Solana (SOL) is at a pivotal juncture in its price trajectory, with technical and on-chain fundamentals aligning to signal a potential breakout toward an all-time high of $295. The $252 level, a historically significant resistance point, has emerged as the critical threshold for bulls. A successful breach here would not only validate multi-timeframe confluence but also ignite a new phase of institutional and retail-driven demand.
Technical Breakout Momentum: The $252 Hurdle
Solana's price action has been confined within an ascending wedge pattern since mid-July, with the $219 level acting as immediate resistance and $252 as the next major barrier [1]. This wedge has been tested three times historically, with each attempt failing to sustain a breakout [1]. However, recent on-chain data reveals a shift in momentum. The Relative Strength Index (RSI) has surged from 42 in mid-June to 62, indicating growing bullish pressure [1]. A V-shaped recovery pattern on the weekly chart further reinforces this narrative, with $252 serving as the neckline of the pattern. Analysts project that a clean breakout above this level could propel SOL toward $295, a 36% increase from current levels [1].
Volume and open interest metrics corroborate the technical case. Open Interest (OI) has hit a record $14.68 billion, reflecting heightened speculative activity [2]. Short liquidations ($10.38 million) have outpaced long liquidations ($6.97 million), suggesting bearish positions are being erased [2]. This dynamic creates a risk-on environment, where a breakout above $252 could trigger cascading buying pressure.
Multi-Timeframe Confluence: A Symphony of Bullish Signals
The strength of Solana's case lies in the alignment of multiple timeframes. On the daily chart, the price is forming an ascending triangle, with the upper resistance at $206 repeatedly tested and the rising trendline confirming consistent buying pressure [3]. A breakout from this pattern would target $222–225, setting the stage for a push toward $252 [3].
On the 4-hour timeframe, a double bottom pattern has emerged around $200, with a neckline at $213–214. Stochastic RSI divergence—where price makes equal lows while the indicator shows higher lows—signals an early trend reversal [3]. Additionally, the $197–192 support zone aligns with key Fibonacci retracement levels and the 200 EMA, creating a confluence of demand [3]. A clean hold above this zone could send SOL back toward $217, with a potential follow-through move to $225–230 [3].
The 1-hour chart reveals a bullish continuation pattern within an ascending channel. SolanaSOL-- is currently trading near $207–208, with $202.84 as a critical support level. A break above $213–218 would confirm the continuation of momentum, with $218 as the immediate target [2].
On-Chain Fundamentals: Network Growth as a Catalyst
Beyond price action, Solana's on-chain metrics tell a compelling story. Total Value Locked (TVL) on the Solana blockchain has surged to an all-time high of $12.27 billion, up 57% from June lows [1]. This growth is driven by protocols like Raydium (32% increase), Jupiter DEX (24%), and Jito liquid staking (18%), which are enhancing the network's utility and liquidity [1].
The memecoin ecosystem has also exploded, with Solana-based memecoins seeing a 70% surge in market capitalization to $12.4 billion in three months [1]. Daily trading volume for these tokens has doubled to $817.3 million, signaling increased network activity and demand for SOL as a base asset [1]. This surge in usage creates a flywheel effect, where higher TVL and DEX volume drive token demand, further supporting price appreciation.
Institutional Catalysts: ETFs and Regulatory Progress
Institutional adoption is another key driver. The Nasdaq listing of SOL StrategiesSTKE-- and a $94 million inflow from major firms have bolstered bullish sentiment [5]. Meanwhile, the U.S. Securities and Exchange Commission (SEC) is reviewing the InvescoIVZ-- Galaxy spot Solana ETF application, a potential game-changer for institutional inflows [1]. With a 99% probability of approval on Polymarket, this development could attract billions in capital, directly targeting the $252 level [4].
Strategic Path Forward: From $252 to $295
The $252 level is not just a technical milestone—it's a psychological and structural inflection pointIPCX--. A breakout here would validate the V-shaped recovery pattern and trigger a cascade of algorithmic and institutional buying. The next key target is $295, where Solana would surpass its previous all-time high.
However, risks remain. If the price fails to break above $252, support zones at $216 and $210 could provide consolidation opportunities [4]. Traders should monitor volume and RSI divergence for signs of waning momentum.
Conclusion
Solana's strategic path to $295 hinges on breaking the $252 resistance level, a target validated by multi-timeframe confluence, robust on-chain fundamentals, and institutional tailwinds. The alignment of technical patterns, volume dynamics, and network growth creates a compelling case for bulls. As the crypto market enters a critical phase, investors should closely watch the $252 level—a potential gateway to a new era for Solana.


Comentarios
Aún no hay comentarios