
SOL's Price Action Near Key Resistance Levels: Technical Analysis and Trader Psychology in October 2025
The Battle for $222 and $225: Solana's Critical Juncture
As of October 2025, SolanaSOL-- (SOL) finds itself at a pivotal crossroads, with traders and analysts fixated on key resistance and support levels that could dictate its near-term trajectory. The $222 and $225 price points have emerged as focal points of technical and psychological significance, reflecting a tug-of-war between bullish momentum and bearish caution.
Technical Analysis: A Layered Defense
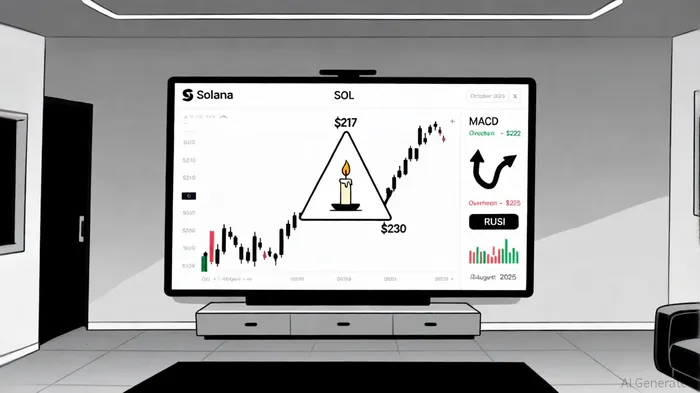
From a technical perspective, $222 has solidified as a critical support level after multiple tests in late 2025. A report by The Currency Analytics notes that this level forms a "trend line for short-term stability," with a breakdown below $200 potentially triggering a cascade toward $180–$190 [1]. Meanwhile, $225 represents a formidable resistance zone. A successful breakout here, accompanied by strong volume, could propel SOLSOL-- toward $235 and eventually $264, as highlighted by Analytics Insight [3].
The Moving Average Convergence Divergence (MACD) and Relative Strength Index (RSI) remain in favorable ranges, suggesting sustained buyer dominance [2]. However, overbought conditions-evidenced by a Stochastic RSI at 100 and a Commodity Channel Index (CCI) above 200-signal short-term risks of profit-taking or corrections [4]. Historical backtesting of similar overbought RSI entries from 2022 to 2025 reveals a cautionary trend: a 69% cumulative loss over 10-day holding periods, with most trades reversing quickly.
Trader Psychology: Optimism vs. Divergence
Social media sentiment for SOL has surged to a rare 18:1 positive-to-negative ratio, driven by institutional developments like BlackRock's tokenized fund integration and GameStop's Solana ecosystem investments [5]. This optimism contrasts with on-chain data showing a 50% drop in network activity since July 2025, raising concerns about a divergence between price and usage [6].
Retail traders remain cautiously optimistic, particularly after large whale movements-such as the transfer of 17,481 SOL to Kraken-sparked renewed interest [7]. Yet, the Fear and Greed Index for SOL reflects extreme greed, a red flag for potential short-term volatility [8].
Institutional Dynamics and ETF Hopes
Institutional activity adds another layer of complexity. The Strategic Solana Reserve's accumulation of 419,000 SOL has reinforced long-term confidence, while delays in ETF approvals have created uncertainty [9]. Analysts remain hopeful for approvals by year-end, which could catalyze institutional inflows and push SOL toward $270–$300 targets [2].
Conclusion: A High-Stakes Game of Inches
Solana's price action near $222 and $225 encapsulates the broader crypto market's duality: robust technical indicators and institutional interest clash with on-chain divergences and overbought conditions. Traders must navigate this tension carefully. A breakout above $225 could unlock a rally toward $264, but a failure to hold $222 may reignite bearish pressures. As the ecosystem evolves, the interplay between technical levels and trader psychology will remain central to SOL's story.


Comentarios
Aún no hay comentarios