
Shiba Inu (SHIB) Triangle Breakout and Momentum Catalysts: A Short-to-Medium-Term Bullish Case
Shiba Inu (SHIB) has entered a pivotal phase in its price action, with technical and on-chain signals converging to form a compelling short-to-medium-term bullish case. The token’s recent consolidation near $0.00001227 has created a triangle pattern—a classic setup for a breakout or breakdown—while on-chain metrics and momentum indicators suggest growing buyer interest.
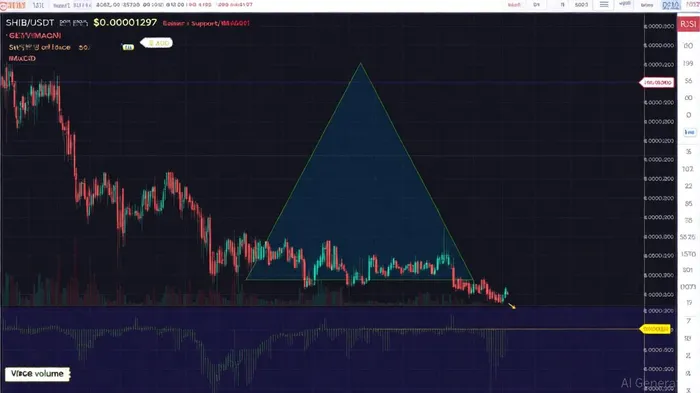
Triangle Patterns: A Dual-Edged Catalyst
SHIB is currently forming both a descending triangle and a symmetrical triangle, each with distinct implications. The descending triangle, defined by a descending resistance line and horizontal support near $0.00001200, has been tested multiple times, with buyers consistently defending the support level [1]. A confirmed breakout above $0.00001297 could trigger a 34% rally to $0.00001600 [1]. Meanwhile, a symmetrical triangle—characterized by converging trendlines—has emerged as SHIBSHIB-- trades between $0.00001200 and $0.00001400. A breakout above $0.00001400 could unlock a 142% surge to $0.00003000, according to CoinPaper analysts [3].
The key to unlocking this potential lies in volume confirmation. While recent trading volume on Binance has averaged $6.51 million, it remains insufficient to drive a decisive breakout [4]. However, the stabilizing open interest in futures markets (between $100 million and $200 million) suggests reduced speculative pressure, potentially setting the stage for a more sustainable move [1].
Momentum Indicators: Mixed Signals with a Bullish Bias
Technical indicators paint a nuanced picture. The Relative Strength Index (RSI) currently sits at 47.83, hovering near neutral territory [4], while the MACD has crossed above its signal line, signaling early bullish momentum [1]. On shorter timeframes, the RSI’s slight upward drift and the MACD’s positive divergence hint at a potential reversal in the triangle’s consolidation phase.
However, the formation of a death cross on the daily chart—where the 50-day moving average dipped below the 200-day average—introduces bearish risks [1]. This pattern historically precedes prolonged downtrends, as seen in SHIB’s drop to $0.00001 in late 2024. Yet, the triangle’s structure suggests that a breakout could negate the death cross’s bearish implications, particularly if volume surges alongside a price push above $0.000014.
On-Chain Catalysts: Token Burns and Supply Dynamics
Beyond price action, on-chain metrics are fueling bullish sentiment. SHIB’s token burn rate has exploded by 201,000% in 24 hours, removing 4.5 million tokens from circulation [3]. This aggressive supply reduction aligns with the broader meme coin narrative, where scarcity drives demand. While the absolute impact of these burns is minimal given SHIB’s massive total supply, the psychological effect on traders cannot be overlooked.
The burn rate’s acceleration coincides with SHIB’s consolidation phase, suggesting that market participants are using the token’s low price as an opportunity to reduce supply. This dynamic could create a self-fulfilling prophecy: as burns increase, the perception of scarcity grows, potentially attracting new buyers and reinforcing the triangle’s breakout potential.
Risk Factors and Key Levels to Watch
Despite the bullish case, risks remain. A breakdown below $0.00001200 could see SHIB retest the death cross’s bearish trajectory, with $0.000010 as a near-term target [2]. Traders should also monitor the Awesome Oscillator (AO), which needs to flip into positive territory to confirm a bullish breakout [2].
Critical levels to watch in the coming weeks include:
- Bullish: $0.0000132 (short-term target), $0.00001400 (triangle breakout), $0.00001600 (34% target).
- Bearish: $0.0000112 (critical support), $0.000010 (near-term breakdown target).
Conclusion: A High-Reward, High-Volatility Scenario
SHIB’s triangle pattern and on-chain catalysts present a high-reward scenario for traders willing to navigate its volatility. While the death cross and declining volume pose risks, the convergence of bullish momentum indicators, token burns, and pattern-specific targets creates a compelling case for a short-to-medium-term breakout. Investors should remain cautious but opportunistic, using key levels as decision points to enter or exit positions.
**Source:[1] Shiba InuSHIB-- Price Analysis: Bearish Triangle Signals Breakout, [https://coinedition.com/shiba-inu-forms-a-descending-triangle-but-key-indicators-are-flashing-bullish/][2] Shiba Inu (SHIB) Biggest 2025 Breakout Is Around, BitcoinBTC-- ..., [https://u.today/shiba-inu-shib-biggest-2025-breakout-is-around-bitcoin-btc-recovery-failed-ethereum-eth-worst-since][3] Shiba Inu Price Eyes 142% Rally as Triangle Pattern Nears ..., [https://coinpaper.com/10890/shiba-inu-price-eyes-142-rally-as-triangle-pattern-nears-breakout-point][4] SHIB Price Prediction: Neutral Consolidation Expected with ..., [https://blockchain.news/news/20250907-price-prediction-target-shib-neutral-consolidation-expected-with-00000128-by]


Comentarios
Aún no hay comentarios