
Shiba Inu (SHIB) at a Crossroads: Analyzing Key Resistance Levels and Market Dynamics for Short-Term Investors
Shiba Inu (SHIB) has long been a speculative favorite in the crypto market, but its recent price action near critical resistance levels of $0.00001294 and $0.0000155 has sparked renewed debate about its short-term trajectory. As of September 2025, SHIBSHIB-- is caught in a tug-of-war between bullish consolidation and bearish continuation, with on-chain data, order book dynamics, and historical patterns offering conflicting signals. This analysis dissects the technical and market structure factors shaping SHIB's near-term outlook.
On-Chain Price Behavior: A Mixed Bag of Signals
SHIB's price has recently broken above a descending resistance line, signaling renewed buying pressure and a potential consolidation phase before further upward movement, as noted in a BraveNewCoin analysis. However, this optimism is tempered by bearish indicators. The 50-day exponential moving average (EMA) at $0.00001306 has acted as a resistance point, with SHIB struggling to break through, according to a CoinEdition analysis. Meanwhile, the token is consolidating between the 20-day and 50-day EMAs, with key support levels at $0.000014 (38.20% Fibonacci level) and $0.00001289 (23.60% Fibonacci level), which CoinEdition also highlighted.
The next major target for SHIB is $0.000016, but this hinges on sustained momentum. If the 50-day EMA fails to hold, a breakdown toward $0.00001270 could reignite bearish sentiment, per BraveNewCoin.
Order Book Dynamics: Liquidity Wars at $0.00001294 and $0.0000155
Order book data from Binance reveals a critical imbalance at these levels. At $0.00001294, buy orders accounted for 47% participation as of October 5, 2025, with historical buy volume peaking at 510.4B (49%) on October 2, according to a Currency Analytics report. This level has historically acted as a support zone, with technical analysts noting an inverted head-and-shoulders pattern.
Conversely, $0.0000155 is a liquidity battleground. Sell orders here have consistently dominated, with 531.5B (53%) of tokens listed for sale on October 3 (BraveNewCoin data). A falling wedge pattern suggests a potential bullish breakout to $0.000017 if bearish momentum reverses, as a CoinSpeaker analysis suggests. However, the sell wall's persistence raises consolidation risks, as traders await a decisive move.
Historical Breakout Patterns: Lessons from the Past
Historical data shows SHIB's volatility peaks when testing these levels. For example, in March 2025, SHIB surged 15% after breaking above $0.000014, only to face a sharp correction as the MVRV ratio spiked into overbought territory, an outcome previously discussed by CoinEdition. Similarly, a 30% rally in May 2025 was followed by a 22% MVRV ratio, indicating holders were sitting on large unrealized gains and primed for profit-taking, as reported by The Currency Analytics.
The current scenario mirrors these patterns. If SHIB can retest $0.00001294 with higher volume and close above the 50-day EMA, it could trigger a bullish cascade. A failure to do so may result in a retest of $0.00001289, where 23.60% Fibonacci support could offer a short-term floor, as noted by CoinEdition.
NVT and MVRV Metrics: Overvaluation Concerns
The Network Value to Transactions (NVT) ratio for SHIB has spiked to 1,194, one of the highest levels in recent months (The Currency Analytics reported this observation). This suggests the token's market cap is outpacing its transactional utility-a red flag for overvaluation. While the NVT ratio declined 2.3% in late September 2025, reflecting increased network activity, The Currency Analytics later discussed triangle patterns that align with this short-term decline, though its commentary appears in a separate piece.
Meanwhile, the MVRV ratio has swung between extremes. In early February 2025, it hit -29.35%, signaling undervaluation (BraveNewCoin data), but surged to 22% in May 2025, indicating overbought conditions (The Currency Analytics). This volatility underscores SHIB's speculative nature and the risk of sharp corrections if sentiment shifts.
Conclusion: Buying Opportunity or Consolidation Play?
SHIB's near-term outlook hinges on three factors:
1. Breakout Confirmation: A sustained close above $0.00001306 (50-day EMA) would validate bullish momentum, with $0.000016 as the next target (BraveNewCoin).
2. Order Book Liquidity: The 47% buy participation at $0.00001294 suggests a potential support hold, but the sell wall at $0.0000155 could force a consolidation phase (BraveNewCoin).
3. NVT/MVRV Balance: A drop in NVT below 1,000 and a MVRV reversion to neutral levels (e.g., -10% to +10%) would signal improved fundamentals (The Currency Analytics).
For short-term traders, $0.00001294 offers a high-probability entry if it holds as support, with a stop-loss below $0.00001289. However, the risks of consolidation at $0.0000155 remain significant, particularly given the bearish NVT reading. Investors should monitor on-chain volume and whale activity for early signs of a breakout or breakdown. 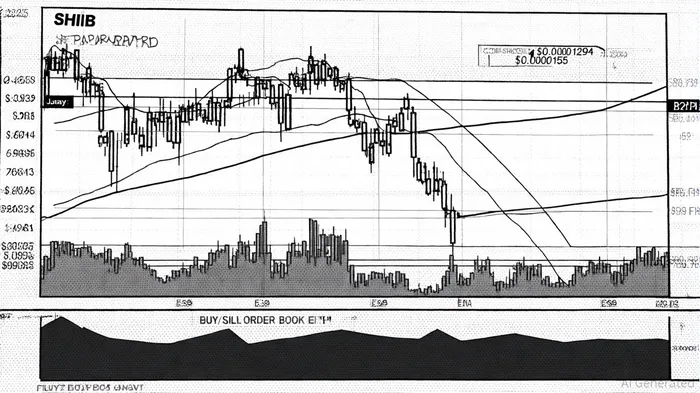


Comentarios
Aún no hay comentarios