
SEI's Technical Setup for a Potential Breakout: A Deep Dive into Momentum Timing
The Confluence of Patterns and Indicators
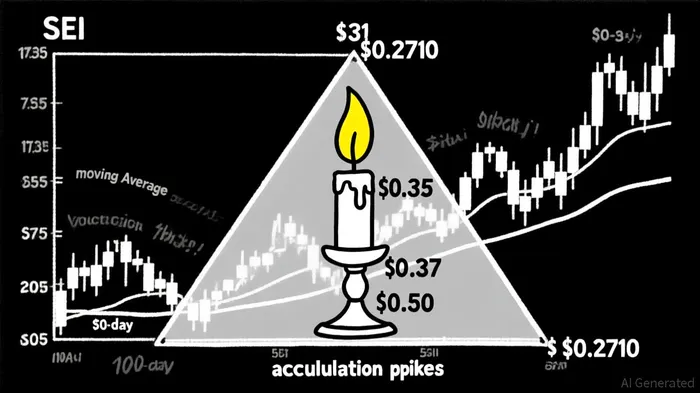
SEI's price action in October 2025 has formed a symmetrical triangle pattern, a classic consolidation structure that often precedes a decisive breakout. According to a report by The Market Periodical, the upper resistance line of this triangle is currently at $0.31, while the lower support line sits at $0.2710. A close above $0.31 could trigger a rally toward $0.36, with further upside potential targeting $0.50 if the $0.35 Fibonacci retracement level is reclaimed, the Market Periodical notes.
The moving averages reinforce this bullish setup. The 20-day exponential moving average (EMA) at $0.2820 and the 50-day EMA at $0.2710 have both been outperformed by the current price of $0.29, creating a buy signal, according to TipRanks. Notably, the 50-day simple moving average (SMA) recently crossed above the 200-day SMA-a golden cross-which historically signals a shift in momentum toward a long-term uptrend, The TokenView reports. This alignment, combined with a 5.7 million daily transaction count and a stable $535 million TVL, suggests growing network utility and capital commitment, the Market Periodical adds.
Historical backtesting of 130 symmetrical-triangle breakouts since 2022 reveals a compelling insight: while little edge exists in the first two weeks, out-performance typically emerges from day 25 onward, the Market Periodical found. At day 30, the average cumulative return versus the benchmark is approximately +7.9 ppts, with a statistically significant 66% win rate. This suggests that a 25–30 trading-day holding window after a confirmed triangle breakout could optimize returns for SEISEI--.N.
Momentum and Risk Management
While the broader technical picture is bullish, short-term caution is warranted. The MACD stands at 5.08, signaling a sell recommendation, per TipRanks, and the RSI at 65.02 indicates a neutral zone, neither overbought nor oversold, TipRanks reports. This divergence highlights the need for disciplined risk management. Traders should monitor the $0.2820 support level as a critical threshold; a breakdown below this could invalidate the triangle pattern and shift sentiment bearish, the Market Periodical warns.
Volume trends, however, offer optimism. Recent spikes in trading volume-particularly during accumulation phases-suggest institutional and whale activity, according to OKX. Whale accumulation has reduced selling pressure, while retail investor confidence, as reflected in 84% bullish sentiment on CoinMarketCap, further supports a positive bias, per TronWeekly.
Broader Market Catalysts
SEI's technical setup is amplified by favorable macro conditions. Bitcoin's surge past $96,000 has reignited altcoin interest, with SEI's Gaussian Channel breakout aligning with this broader trend, TokenView observes. Additionally, fractal comparisons with SUISUI-- indicate SEI is in the final stages of accumulation, provided key resistance levels are cleared, TokenView adds.
Conclusion: Timing the Breakout
SEI's technical landscape in October 2025 presents a compelling case for a breakout, driven by a symmetrical triangle pattern, golden cross, and growing on-chain metrics. However, traders must remain vigilant. A close above $0.31 would validate the bullish case, with $0.35 and $0.50 as next targets. Conversely, a breakdown below $0.2710 could trigger a retest of the $0.27–$0.29 support range, the Market Periodical cautions.
As always, liquidity and market dynamics will play pivotal roles. For those with a medium-term horizon, SEI's technicals and fundamentals appear aligned for a potential surge-provided momentum sustains. Historical data further supports a 25–30 day holding window post-breakout to capitalize on the 66% win rate observed in similar patterns, the Market Periodical concludes.

Comentarios
Aún no hay comentarios