
Sei (SEI) Reaching Key Support Levels - A Strategic Buying Opportunity?
Sei (SEI), the native token of the SeiSEI-- Network, has drawn significant attention in October 2025 as it consolidates near critical support and resistance levels. Technical indicators and on-chain metrics suggest a potential momentum reversal, raising the question: Is this a strategic buying opportunity or a cautionary consolidation phase?
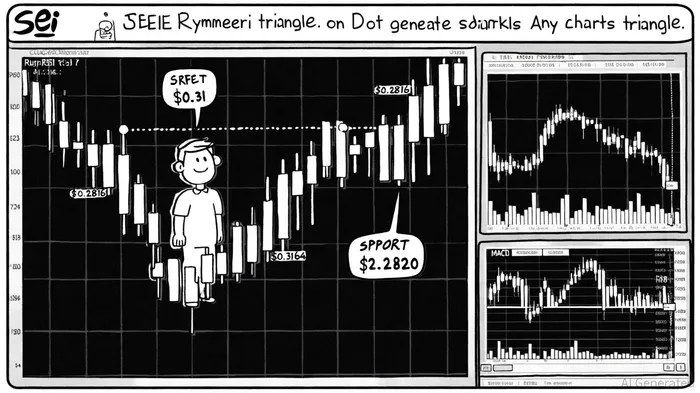
Symmetrical Triangle and Breakout Potential
SEI is currently forming a symmetrical triangle pattern, a classic technical setup where price action oscillates between converging trendlines. The descending resistance at $0.31 and ascending support at $0.2820 have defined a narrowing range, with a projected breakout target of $0.36 if bulls overcome the upper boundary, according to The Market Periodical. Analysts like Ali Martinez note that such patterns often precede sharp directional moves, particularly when volume surges upon a breakout, the Market Periodical reports.
The inverse head-and-shoulders pattern on the daily chart adds further intrigue. A successful break above $0.35 could validate a bullish case, with a target of $0.48 based on the measured move from the pattern's neckline, per a CCN analysis. This aligns with classical pivot points, where $0.2816 represents the strongest support level, and $0.3164 acts as a near-term resistance according to a CoinCheckup analysis.
RSI and MACD: Mixed Signals
While the Relative Strength Index (RSI) has entered overbought territory at 78, signaling potential short-term corrections, the MACD tells a different story. The indicator shows bullish crossovers and a rising histogram, suggesting sustained upward momentum, as CoinCheckup's analysis indicates. This divergence between RSI and MACD is common in strong trends, where buying pressure outpaces profit-taking, and Bitget's technicals also highlight these dynamics based on price and momentum readings: Bitget technicals.
However, platforms like TradingView and Bitget highlight a short-term sell bias based on moving averages and oscillator indicators, cautioning against overreliance on bullish signals. This underscores the importance of monitoring volume and order flow during a breakout attempt.
On-Chain Activity and Network Fundamentals
On-chain data reinforces the narrative of growing engagement. Daily transactions have surged to 5.7 million, while Total Value Locked (TVL) stands at $535.1 million, indicating moderate stability, the Market Periodical reports. These metrics suggest that the Sei Network is attracting both retail and institutional activity, which could fuel further price appreciation if the $0.31 resistance is decisively breached.
Strategic Buying Opportunity?
For long-term investors, the $0.27–$0.29 support range remains a critical area to watch. A breakdown below $0.267 could trigger a retest of the fair value gap (FVG) region, presenting a high-risk, high-reward entry point, according to a CoinEngineer analysis. Conversely, a breakout above $0.31 would likely see SEI targeting $0.36 in the short term and $0.50 in the medium term, as CoinEngineer notes.
Key risks include macroeconomic headwinds and regulatory uncertainty, which could amplify volatility. However, the alignment of technical patterns, on-chain metrics, and moderate TVL suggests that SEI is in a phase of consolidation rather than a bearish capitulation.
Conclusion
Sei (SEI) is at a pivotal juncture. The convergence of symmetrical triangle patterns, bullish MACD signals, and rising on-chain activity points to a potential breakout. While short-term overbought conditions and mixed oscillator readings warrant caution, the long-term case for SEI hinges on its ability to reclaim $0.35 resistance. Investors with a medium-term horizon may find strategic value in monitoring these levels, using stop-loss orders to mitigate downside risk.


Comentarios
Aún no hay comentarios