
SEI's Chart Patterns and the Case for a Bullish Breakout in the Dollar Index
The Convergence of Technicals and Sentiment: A Bullish Case for SEI
The cryptocurrency market in 2025 is a theater of contrasts. While macroeconomic headwinds persist, niche assets like SeiSEI-- (SEI) are defying the narrative with robust on-chain metrics and compelling technical setups. For investors, the interplay between SEI's chart patterns and the US Dollar Index (DXY) offers a unique opportunity to align with a bullish breakout—provided one deciphers the nuanced dance between dollar strength and risk-on sentiment.
SEI's Technical Catalysts: Patterns and Momentum
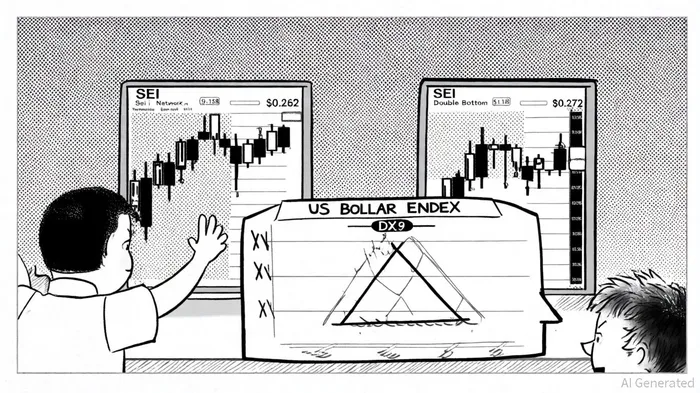
SEI has emerged as a standout performer in the mid-cap crypto space, driven by a confluence of technical and fundamental factors. On the charts, the token has formed a textbook double-bottom pattern with a critical support level at $0.168 and a neckline at $0.272[1]. A breakout above this level would validate a reversal from bearish to bullish sentiment, with Fibonacci retracement targets at $0.35 (38.2%), $0.37 (50%), and $0.50 (61.8%)[1].
Further reinforcing the bullish case is the inverse head and shoulders (iH&S) pattern on the weekly timeframe. This formation, confirmed by a break above $0.305, suggests a potential rally to $0.4895, $0.6720, and even $0.8900[5]. Shorter-term traders are also eyeing a bull flag pattern, where a sharp rise in price is followed by a consolidation phase within a descending channel. A breakout from this pattern could target $0.45, with volume spikes indicating strong institutional accumulation[5].
On-chain data adds credibility to these technical signals. Active addresses on the SEI network have surged to 7.6 million, and daily transactions have crossed 1.6 million, reflecting growing utility and adoption[1]. Whale activity has further reduced sell-side liquidity, creating a favorable environment for upward price discovery[1].
Historical backtests of the double-bottom pattern in cryptocurrencies reveal mixed outcomes. From 2022 to 2025, a mechanical strategy of buying on double-bottom confirmation and holding for 30 trading days yielded a total return of -5.96%, with an average trade return of +0.03%[6]. While some trades captured sharp rebounds (e.g., a +31.98% gain in one instance), losses dominated due to a 28.9% maximum drawdown and a Sharpe ratio of approximately -0.01[6]. These results underscore the pattern's volatility and the need for complementary risk controls, such as stop-losses or volume filters, to improve risk-adjusted returns[6].
DXY's Dilemma: Consolidation or Breakout?
The US Dollar Index (DXY), currently trading near 103.9, is in a critical phase of consolidation. Technical analysts have identified a symmetrical triangle pattern, with key resistance at 110–120 and support at 97–101[3]. A breakout above 110 would signal a multi-year bullish trend for the dollar, driven by Fed policy and inflation dynamics[3]. Conversely, a failure to break above this level could see the index retreat to 85–90, favoring risk-on assets like SEI[3].
The DXY's trajectory is pivotal for SEI. Historically, a strong dollar has acted as a headwind for cryptocurrencies and equities, as it reflects risk-averse sentiment and capital flight to USD-denominated assets[4]. For example, a DXY rally to 120 could suppress SEI's price by reducing demand for alternative investments. However, if the Fed adopts a dovish stance—potentially leading to rate cuts in late 2025—the DXY's decline could create a tailwind for SEI's breakout[2].
The Correlation Conundrum: Dollar Strength vs. SEI's Fundamentals
While the inverse relationship between DXY and SEI is well-documented[4], the token's fundamentals are increasingly decoupling from macroeconomic headwinds. SEI's ecosystem growth, including a surge in Total Value Locked (TVL) and institutional partnerships (e.g., Wyoming's WYST stablecoin), suggests that its price may align more closely with on-chain utility than dollar volatility[1].
For instance, even as the DXY fluctuates between 95 and 100 in 2025[3], SEI's TVL has grown by 30%, and active addresses have doubled to 7.6 million[1]. These metrics indicate that the token's value proposition—high-throughput blockchain and DeFi integration—is gaining traction independent of the dollar's strength.
Market Sentiment: A Tipping Point?
The final piece of the puzzle is market sentiment. Derivatives markets remain bearish on SEI, with negative funding rates (-0.02%) suggesting short-term bearish bets[1]. However, this creates a potential short squeeze if buying pressure intensifies. Meanwhile, the Fear & Greed Index for crypto is at 44 (Fear), indicating undervaluation and a possible inflection point[5].
For DXY, sentiment is split. A breakout above 110 would likely trigger a wave of risk-off behavior, but a failure to do so could see capital reallocate to equities and crypto. Given SEI's technical setup and ecosystem growth, it's well-positioned to capitalize on a weaker dollar scenario.
Conclusion: A Calculated Bet on SEI
The case for a bullish breakout in SEI hinges on two key factors:
1. Technical Validation: A confirmed breakout above $0.35 and $0.37 resistance levels, supported by RSI and MACD momentum.
2. DXY Dynamics: A failure of the DXY to break above 110, preserving risk-on sentiment and allowing SEI to rally toward $0.45–$0.89.
While the DXY's trajectory introduces uncertainty, SEI's fundamentals and technicals present a compelling asymmetry. For investors, this is a high-conviction trade that rewards patience and a nuanced understanding of macro-micro interplay.

Comentarios
Aún no hay comentarios