
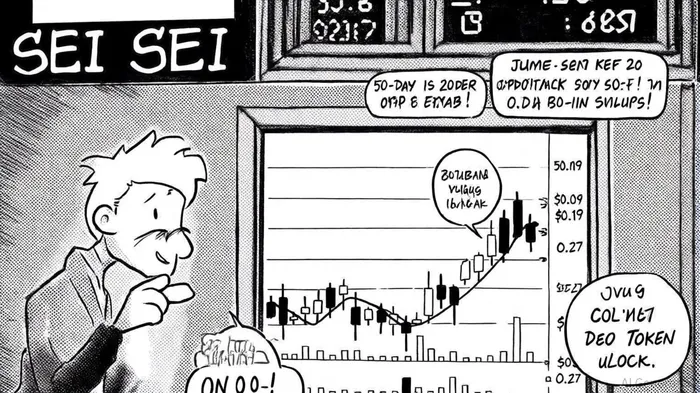
SEI's $0.19 Support Level: A Technical Crossroads for Near-Term Breakout Potential
The SeiSEI-- (SEI) token has entered a pivotal phase in its price trajectory, with the $0.19 support level emerging as a critical battleground for bulls and bears. As of October 15, 2025, SEI trades at $0.215411, hovering near this psychological threshold after a volatile summer marked by mixed signals. Technical analysts and on-chain data suggest a high-stakes scenario: a breakout above $0.19 could reignite a rally toward $0.30, while a breakdown risks a cascade to $0.18, testing the asset's resilience in a bearish macroclimate, according to a SEI price analysis.
Technical Indicators: Bearish Momentum vs. Oversold Conditions
SEI's short-term technical profile is a study in contradictions. The token remains below both its 50-day ($0.3017) and 200-day ($0.2608) moving averages, a bearish signal that underscores underperformance relative to historical benchmarks, as noted in the analysis. However, the Relative Strength Index (RSI) has dipped to 25.49, entering oversold territory-a condition often preceding rebounds in liquid markets. This duality creates a strategic dilemma for traders: while oversold readings historically suggest buying opportunities, the broader bearish sentiment, reflected in a Fear & Greed Index score of 29 (indicating fear), tempers optimism.
Volume patterns further complicate the narrative. On October 11, 2025, SEI plummeted 25.63% in 24 hours, accompanied by a 179.63% surge in trading volume-a classic bear trap or a prelude to capitulation? Analysts like Michaël van de Poppe argue that such volatility often precedes breakouts, citing increased on-chain activity and a 10% momentum gain near $0.19 as bullish catalysts. Conversely, a triangle pattern in the price chart hints at a potential $0.75 target if the ascending support line holds, though this remains speculative without a confirmed breakout, according to Tron Weekly.
On-Chain Activity and Fundamental Catalysts
On-chain metrics offer a nuanced view. The Sei Network's transaction count rose 8% over 48 hours as of June 20, 2025, suggesting growing user adoption, as the earlier analysis observed. Total Value Locked (TVL) has surpassed $540 million, while decentralized exchange (DEX) volume regularly exceeds $60 million, indicating robust ecosystem activity, according to Cryptopolitan. These fundamentals could provide a floor for the price, particularly if institutional partnerships-such as the recent integration of native USDC-gain traction, as noted in the analysis.
Yet, near-term risks loom large. A $12 million token unlock scheduled for late October threatens to flood the market with supply, historically triggering 5–15% selloffs before stabilization, as reported by Tron Weekly. This event, combined with macroeconomic headwinds like trade war-related jitters, amplifies the bear case for SEI, per Cryptopolitan's coverage.
Near-Term Strategy: Watching the $0.19–$0.27 Range
For traders, the $0.19–$0.27 range represents a make-or-break scenario. A sustained close above $0.19 could validate the June 20 breakout and target $0.30, as posited by van de Poppe in the analysis. Conversely, a breakdown below $0.19 would likely accelerate the decline toward $0.18, with the 200-day moving average ($0.2608) acting as a secondary resistance level.
The RSI's oversold condition and the triangle pattern's potential for a $0.75 move offer hope for bulls, but these signals must be corroborated by volume and price action. For now, the market is in a holding pattern, with the $0.27 resistance level serving as a critical inflection point.
Conclusion: A High-Risk, High-Reward Scenario
SEI's technical and fundamental profiles paint a picture of an asset at a crossroads. While the $0.19 support level offers a lifeline for bulls, the looming token unlock and bearish momentum create a precarious environment. Investors should treat any rally above $0.19 with caution, using it as an opportunity to reassess risk exposure rather than a green light for aggressive buying. In the short term, the path of least resistance appears downward, but the long-term potential-bolstered by TVL growth and institutional partnerships-remains intact.

Comentarios
Aún no hay comentarios