
RTX Inc's P/E Ratio: Assessing Valuation Attractiveness and Growth Potential in 2025
Raytheon Technologies Corporation (RTX) has long been a cornerstone of the aerospace and defense sector, but its current valuation metrics raise critical questions for investors. As of November 26, 2025, RTXRTX-- trades at a Price to Earnings (P/E) ratio of 34.52, calculated using the latest closing stock price and trailing twelve months (TTM) earnings per share (https://www.marketbeat.com/instant-alerts/rtx-nysertx-hits-new-1-year-high-whats-next-2025-12-15/). This figure sits below the company's 10-year historical average of 81.61 (https://fullratio.com/stocks/nyse-rtx/pe-ratio) but exceeds the industry's recent quarterly average of 30.21 (https://www.macrotrends.net/stocks/charts/RTX/rtx/pe-ratio). To determine whether RTX is undervalued relative to its fundamentals and future earnings trajectory, we must dissect its valuation in the context of both historical trends and sector dynamics.
Historical Context and Industry Benchmarking
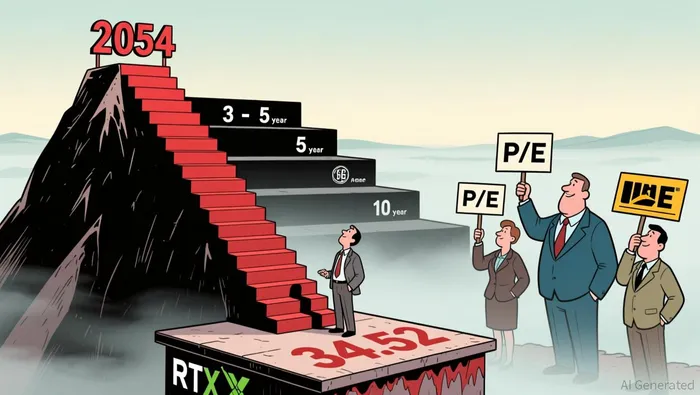
RTX's current P/E of 34.52 is 56% lower than its decade-long average, a stark contrast to the 2,054 peak observed in June 2020 (https://fullratio.com/stocks/nyse-rtx/pe-ratio). This decline reflects a broader shift in market sentiment, as investors have grown more cautious about the company's long-term earnings potential. However, the P/E ratio is still 5% higher than the 3- and 5-year averages of 34.95 and 35.5, respectively (https://fullratio.com/stocks/nyse-rtx/pe-ratio), suggesting a mixed valuation picture.
 Relative to peers, RTX's P/E is lower than GE Aerospace's 39.70 but higher than Caterpillar Inc.'s 30.23 (https://www.wisesheets.io/pe-ratio/RTX). The industry median P/E of 44.095 (https://www.gurufocus.com/term/pettm/RTX) further underscores that RTX is trading at a discount to the broader sector's median valuation. This discrepancy hints at potential undervaluation, particularly given RTX's robust $251 billion backlog and exposure to high-growth defense modernization programs (https://www.tikr.com/blog/rtx-stock-prediction-where-analysts-see-the-stock-going-by-2027).
Forward P/E and Earnings Growth Projections
Looking ahead, RTX's forward P/E ratio ranges between 26.34 and 27.81 (https://www.nasdaq.com/articles/rtx-rtx-rises-higher-market-key-facts-0), reflecting analysts' optimism about its 2025 earnings. Projected 2025 EPS of $6.11 (https://www.marketbeat.com/instant-alerts/rtx-nysertx-hits-new-1-year-high-whats-next-2025-12-15/) and a compound annual growth rate (CAGR) of 11.2% through 2027 (https://www.tikr.com/blog/8-5-dividend-growth-backed-by-11-earnings-growth-is-rtx-stock-a-smart-long-term-buy) position RTX to outpace the aerospace and defense sector's 2.76% CAGR (https://www.statista.com/outlook/io/manufacturing/transportation-vehicle-manufacturing/aerospace-defense-manufacturing/worldwide?srsltid=AfmBOorkoSEUf07QWLE6xpRtb7HGyxcr1axD0yZNtcP8ITKxprrkvdVx). This growth is driven by rising global defense budgets and a rebound in commercial aviation demand, which bolster both of RTX's core segments: Collins Aerospace and Pratt & Whitney.
Despite these fundamentals, the stock's valuation appears stretched. A price-to-earnings growth (PEG) ratio of approximately 2.41 (calculated as forward P/E divided by earnings growth) suggests the stock is overvalued relative to its growth prospects (https://www.tikr.com/blog/8-5-dividend-growth-backed-by-11-earnings-growth-is-rtx-stock-a-smart-long-term-buy). This is further supported by analyst price targets averaging $188, implying only 6% upside from the current price of $179 (https://www.tikr.com/blog/rtx-stock-prediction-where-analysts-see-the-stock-going-by-2027). A discounted cash flow (DCF) analysis even estimates RTX is overvalued by 13.6% at current levels (https://simplywall.st/stocks/us/capital-goods/nyse-rtx/rtx/news/has-rtxs-48-surge-in-2025-already-priced-in-defense-and-aero), signaling that much of the anticipated growth is already priced in.
Risks and Competitive Dynamics
RTX's valuation challenges are compounded by macroeconomic headwinds. Tariffs, supply chain bottlenecks, and labor shortages-common across the sector-threaten to delay production and inflate costs. Additionally, while RTX's forward P/E of 27 is lower than its 10-year average, it trades at a premium to peers like Lockheed Martin (16.58x forward P/E) (https://www.nasdaq.com/articles/rtx-vs-lockheed-martin-which-defense-stock-consider-2025). This premium may not be justified if global defense spending slows or if the company fails to execute on its $86.5–$87 billion sales outlook (https://www.cnbc.com/2025/10/21/defense-ge-northrop-grumman-rtx-lockheed-martin-earnings.html).
Conclusion: A Cautionary Outlook
RTX's P/E ratio appears to straddle the line between undervaluation and overvaluation. While its current multiple is significantly lower than historical averages and offers a discount to the industry median, the stock's forward P/E and PEG ratio suggest it is priced for aggressive growth that may not materialize. Investors should weigh RTX's strong backlog and defense sector tailwinds against its valuation risks and operational challenges. For now, the stock may appeal to long-term holders seeking exposure to the aerospace and defense sector but appears less compelling for those prioritizing near-term growth.


Comentarios
Aún no hay comentarios