
QGRO as a Strategic Alternative to Traditional Large-Cap Benchmarks
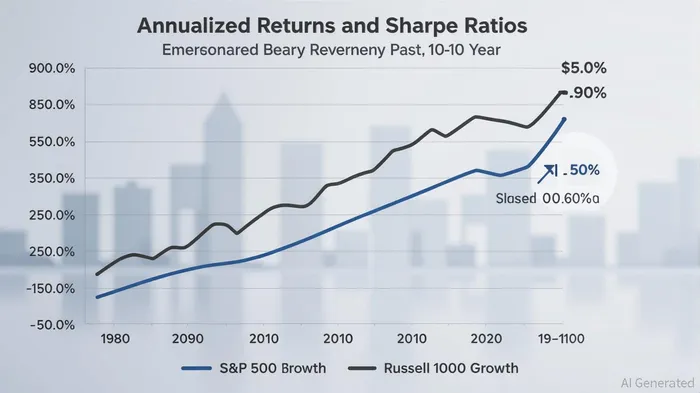
In the evolving landscape of U.S. equities, investors seeking alternatives to traditional large-cap benchmarks like the S&P 500 and Russell 1000 Growth must weigh not just raw returns but also risk-adjusted performance and compounding potential. The American Century U.S. Quality Growth ETF (QGRO) emerges as a compelling option, offering a unique blend of growth-oriented exposure and disciplined risk management. Over the past five to ten years, QGRO has demonstrated a Sharpe ratio of 1.10, outperforming the S&P 500’s 0.85 and the Russell 1000 Growth’s 0.83 [1]. This metric, which measures returns per unit of risk, underscores QGRO’s ability to generate superior risk-adjusted outcomes despite its higher volatility (standard deviation of 23.01% versus 19.72% for the S&P 500) [2].
Diversified Growth Allocation: A Structural Edge
QGRO’s strategy centers on large- and mid-cap U.S. companies with strong quality and growth fundamentals, as defined by metrics like earnings growth, return on equity, and low debt-to-equity ratios [3]. Its portfolio is overweight in industrials (+7.6%), technology (+6.4%), and consumer discretionary (+4.7%) relative to the Russell 1000 [4]. This sector tilt aligns with industries that have historically outperformed during economic expansions and technological innovation cycles. For instance, QGRO’s 37.19% allocation to technology [5]—a sector that has driven much of the market’s gains in recent years—positions it to capitalize on trends like AI and cloud computing.
In contrast, the S&P 500 and Russell 1000 Growth rely on rules-based methodologies that can lag in incorporating fast-growing companies or IPOs [6]. The S&P 500, for example, has a median market cap of $31.71 billion, while the Russell 1000 includes smaller firms with a median cap of $13.2 billion [7]. QGRO’s focus on mid-cap growth stocks bridges this gapGAP--, offering exposure to companies with higher growth potential than the S&P 500’s mega-cap heavyweights but with more stability than the Russell 1000’s broader, more volatile mid-cap segment.
Long-Term Compounding and Risk Management
While the Russell 1000 Growth has historically delivered higher annualized returns (15.48% over 20 years) than the S&P 500 (11.37%) [8], QGRO’s 15.13% five-year annualized return [1] places it in a similar range while maintaining a superior risk profile. This balance is critical for long-term compounding, as excessive volatility can erode returns through forced selling during downturns. QGRO’s monthly rebalancing and emphasis on quality metrics (e.g., consistent earnings growth of 12.8% annually [9]) further mitigate downside risks compared to the broader indices.
A recent example of this dynamic is QGRO’s 25.08% return over the past 12 months, outpacing the S&P 500’s 16.58% [10]. This performance highlights the ETF’s ability to harness growth in high-quality sectors during favorable market conditions while its disciplined approach limits overexposure to speculative or underperforming stocks.
Strategic Considerations for Investors
For investors prioritizing long-term compounding, QGRO’s structure offers a middle ground between the S&P 500’s stability and the Russell 1000’s volatility. Its active management (via rules-based screening for quality and growth) and sector specialization create a diversified yet focused portfolio that can adapt to shifting economic cycles. However, its higher expense ratio and volatility compared to the S&P 500 necessitate a longer investment horizon to fully realize its risk-adjusted advantages.
In conclusion, QGRO’s strategic allocation to quality growth stocks, combined with its superior Sharpe ratio and sector-specific exposure, positions it as a robust alternative to traditional benchmarks. While it may not match the S&P 500’s brand recognition or the Russell 1000’s breadth, its disciplined approach to risk and growth makes it a compelling choice for investors seeking to enhance compounding potential without sacrificing prudence.
Source:
[1] QGRO vs. SPY — ETF Comparison Tool [https://portfolioslab.com/tools/stock-comparison/QGRO/SPY]
[2] QGRO vs. SPY — ETF Comparison Tool [https://portfolioslab.com/tools/stock-comparison/QGRO/SPY]
[3] American Century U.S. Quality Growth ETF [https://www.americancentury.com/invest/funds/american-century-us-quality-growth-etf/]
[4] QGRO: Diversification Has Not Been An Advantage For ... [https://seekingalpha.com/article/4722906-qgro-diversification-has-not-been-an-advantage-for-this-quality-growth-etf]
[5] American Century US Quality Growth ETF (QGRO) Holdings [https://finance.yahoo.com/quote/QGRO/holdings/]
[6] Untangling the differences between the Russell 1000 Index® and S&P 500 [https://www.lseg.com/en/ftse-russell/research/differences-between-russell-1000-s-and-p-500]
[7] S&P 500 vs. Russell 1000: What's the Difference? [https://www.investopedia.com/articles/investing/022416/investment-fundamentals-sp-500-index-vs-russell-1000-index.asp]
[8] Russell 1000 Growth vs S&P 500: historical performance [https://curvo.eu/backtest/en/compare-indexes/russell-1000-growth-vs-sp-500]
[9] QGRO: Diversification Has Not Been An Advantage For ... [https://seekingalpha.com/article/4722906-qgro-diversification-has-not-been-an-advantage-for-this-quality-growth-etf]
[10] QGRO vs. SPY — ETF Comparison Tool [https://portfolioslab.com/tools/stock-comparison/QGRO/SPY]


Comentarios
Aún no hay comentarios