
QDTE vs. QQQI: Evaluating Income Potential and Risk for Dividend-Focused Investors
QDTE vs. QQQI: Evaluating Income Potential and Risk for Dividend-Focused Investors
For dividend-focused investors, the choice between the Roundhill N-100 0DTE Covered Call Strategy ETF (QDTE) and the NEOS Nasdaq 100 High Income ETF (QQQI) hinges on balancing income generation potential against risk-adjusted returns. Both ETFs target income from the Nasdaq-100 index but employ divergent strategies, leading to stark differences in performance metrics.
Income Generation: QDTE's Premium-Driven Edge
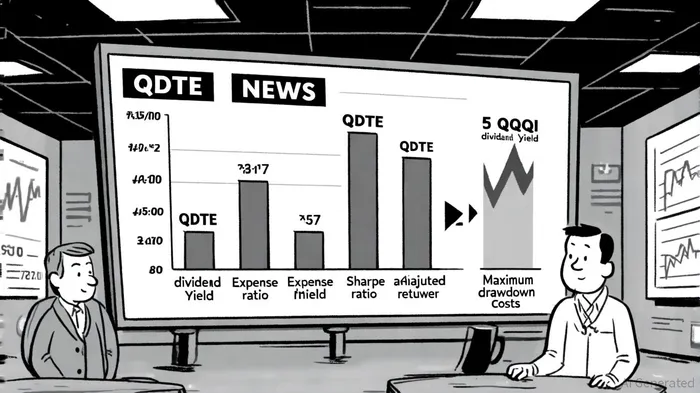
QDTE's 0DTE covered call strategy-selling options contracts that expire on the day of trade-has driven a trailing twelve-month (TTM) dividend yield of 39.05%, far outpacing QQQI's 13.75%, according to PortfoliosLab. This disparity reflects QDTE's aggressive income-seeking approach, which leverages daily options premiums to boost payouts. For instance, QDTE distributed $0.804 per share on December 19, 2024, according to DRIPCalc. However, this strategy introduces variability: QDTE's dividend history shows frequent, uneven payouts, whereas QQQI offers more predictable, albeit modest, distributions, according to StockAnalysis.
QQQI, by contrast, combines Nasdaq-100 exposure with a high-yield strategy that prioritizes stability. Its lower yield reflects a focus on capital preservation and consistent income, making it a safer bet for investors wary of volatility in dividend amounts, as PortfoliosLab notes.
Cost and Risk: QQQI's Structural Advantages
While QDTE's income potential is compelling, its 0.95% expense ratio exceeds QQQI's 0.68%, a critical consideration for long-term investors. PortfoliosLab's data show the higher cost of QDTE may erode returns, particularly in markets where its options strategies underperform.
Risk-adjusted returns further tilt the balance toward QQQI. PortfoliosLab reports QQQI's Sharpe ratio of 1.36 outperforms QDTE's 1.15, indicating superior returns relative to total risk. The Sortino ratio, which measures returns against downside risk, also favors QQQI at 1.61 versus QDTE's 1.24. Volatility metrics are nearly identical (2.94% for QQQI vs. 2.99% for QDTE), but QDTE's maximum drawdown of -22.86% since inception exceeds QQQI's -20.00%, highlighting its greater vulnerability to market downturns.
Strategic Trade-Offs for Income Investors
The divergence between QDTE and QQQI underscores a fundamental trade-off: high yield versus risk control. QDTE's 0DTE strategy amplifies income potential but sacrifices upside participation in rising markets and exposes investors to larger drawdowns. QQQI's approach, while less aggressive, offers a more balanced profile, particularly for those prioritizing downside protection.
For investors with a high-risk tolerance seeking to maximize current income, QDTE's elevated yield may justify its costs and volatility. However, those prioritizing long-term capital preservation and consistent payouts-despite lower yields-may find QQQI's structure more aligned with their goals.
Conclusion
In the QDTE versus QQQI debate, the optimal choice depends on an investor's risk appetite and income needs. QDTE's 39.05% yield is unmatched in the Nasdaq-100 space, but its higher expenses and risk metrics demand careful consideration. QQQI, with its 13.75% yield, lower costs, and superior risk-adjusted returns, presents a more conservative alternative. As markets evolve, investors must weigh these factors against their own financial objectives and market outlooks.


Comentarios
Aún no hay comentarios