
Q3 Recap: Sector Performances and a Look Ahead to Q4
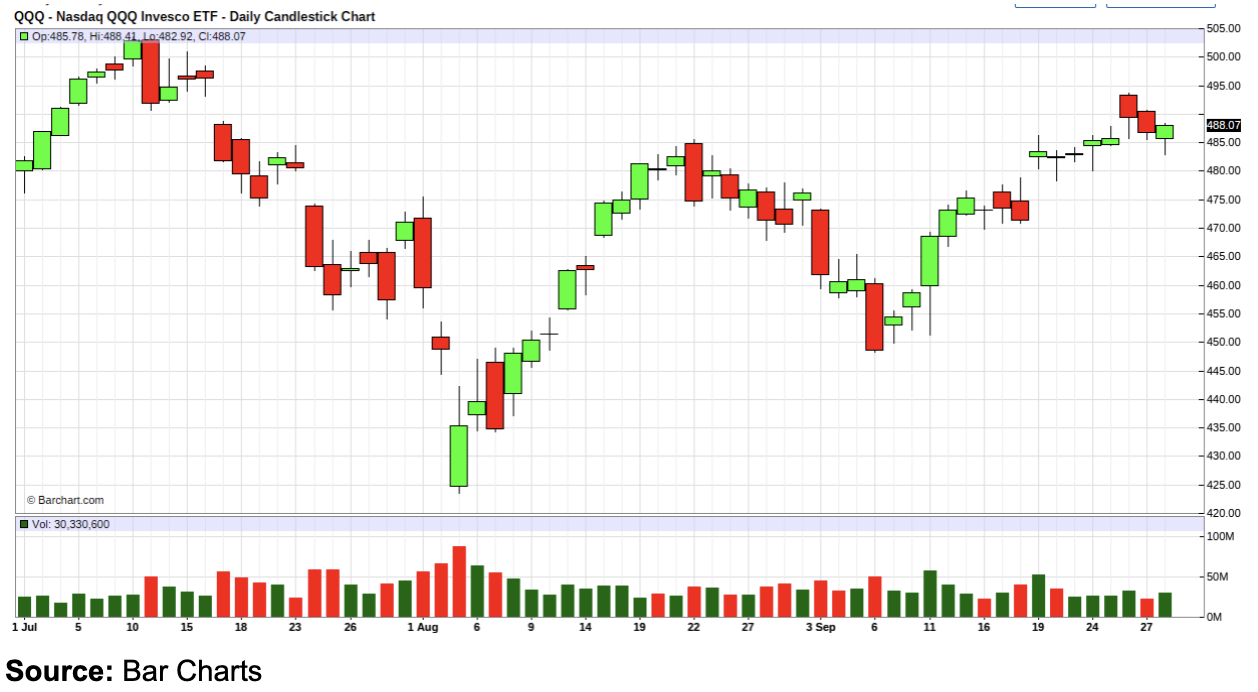
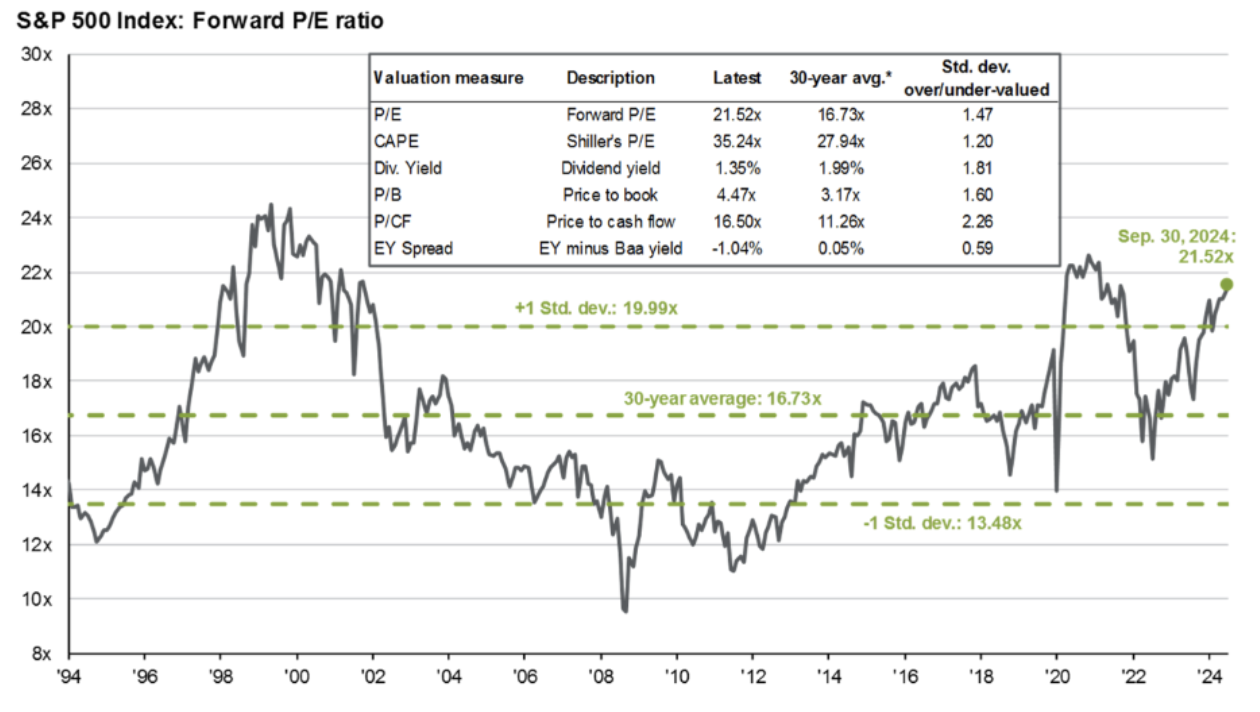
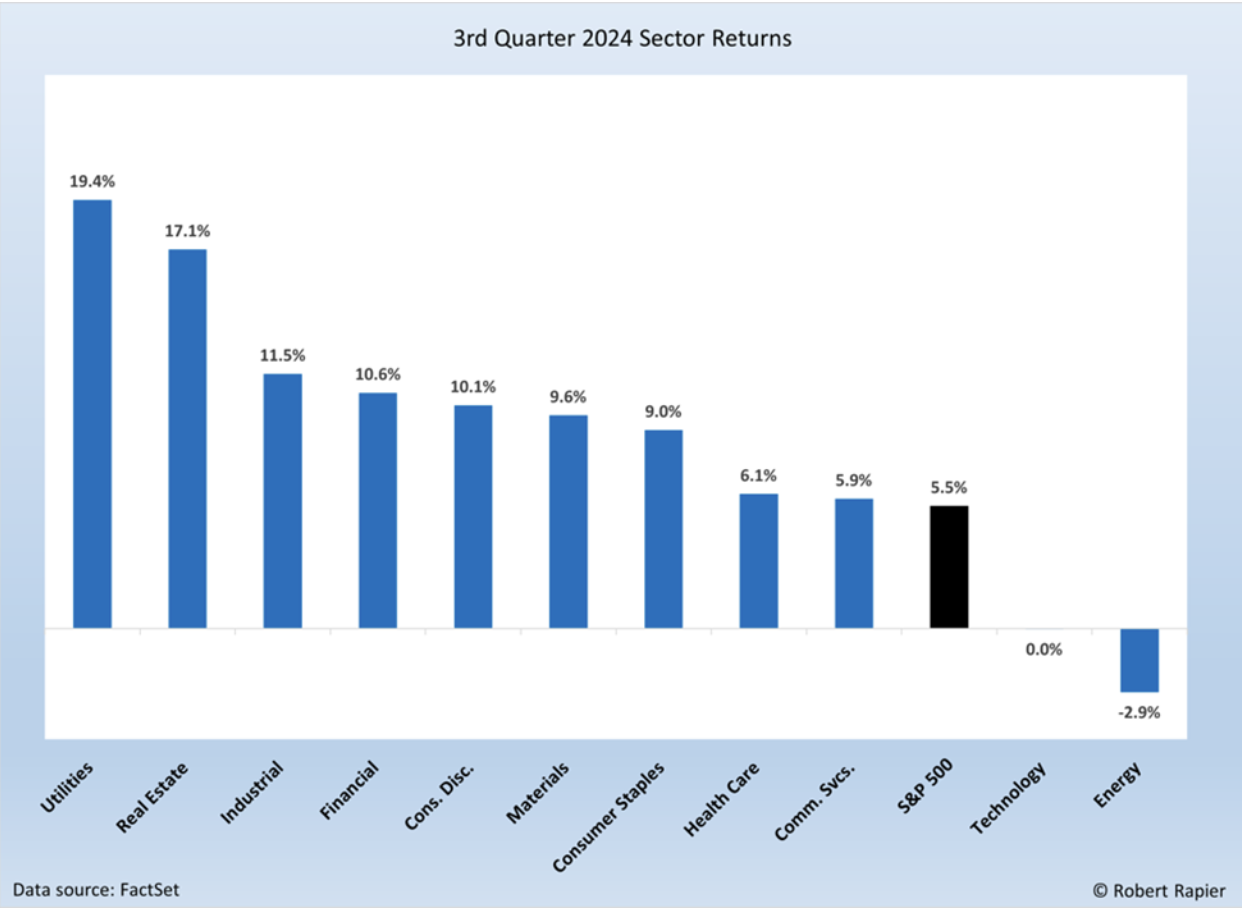
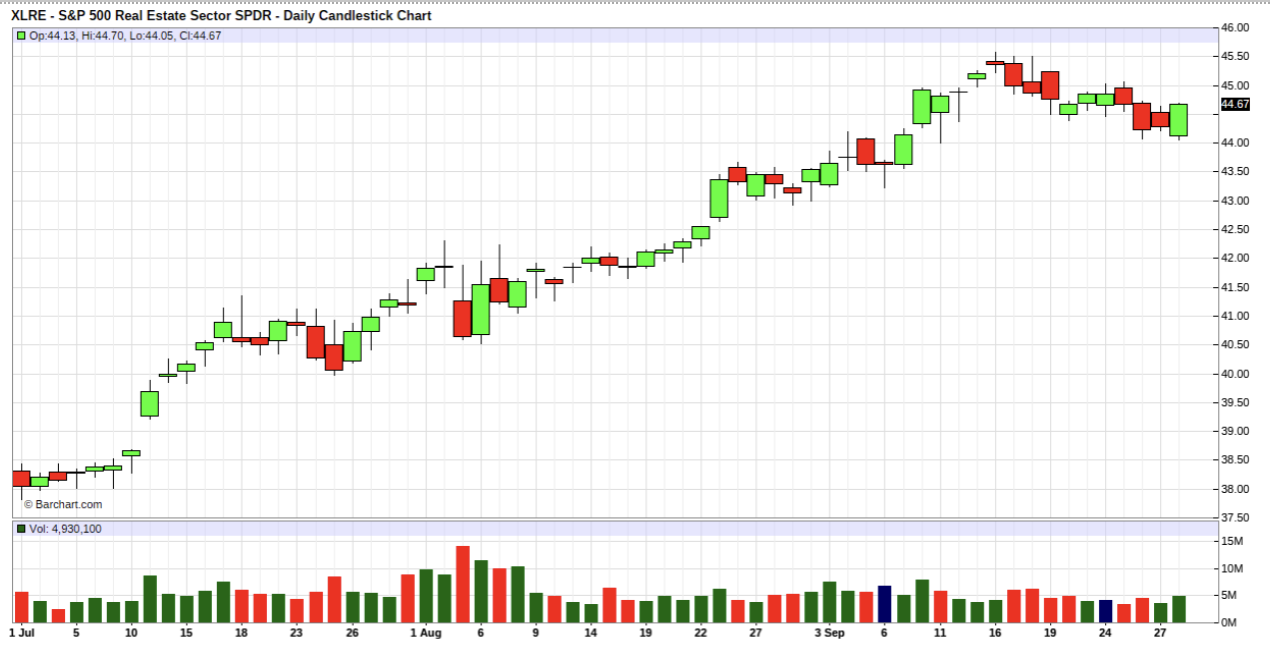
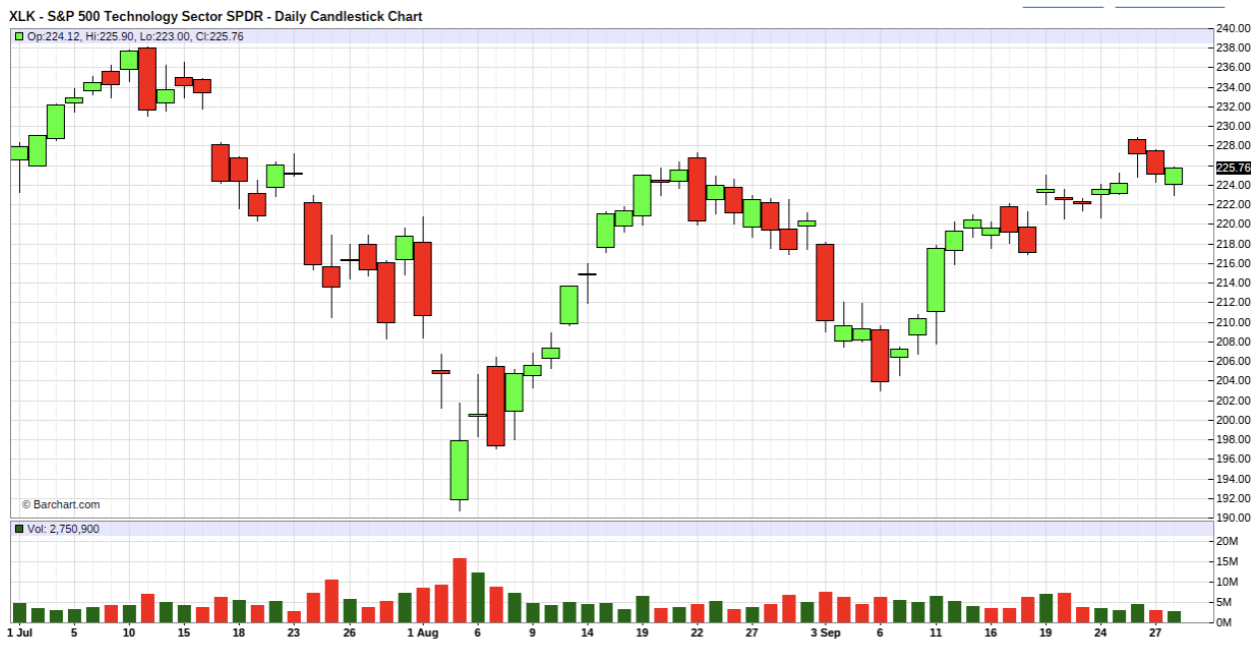
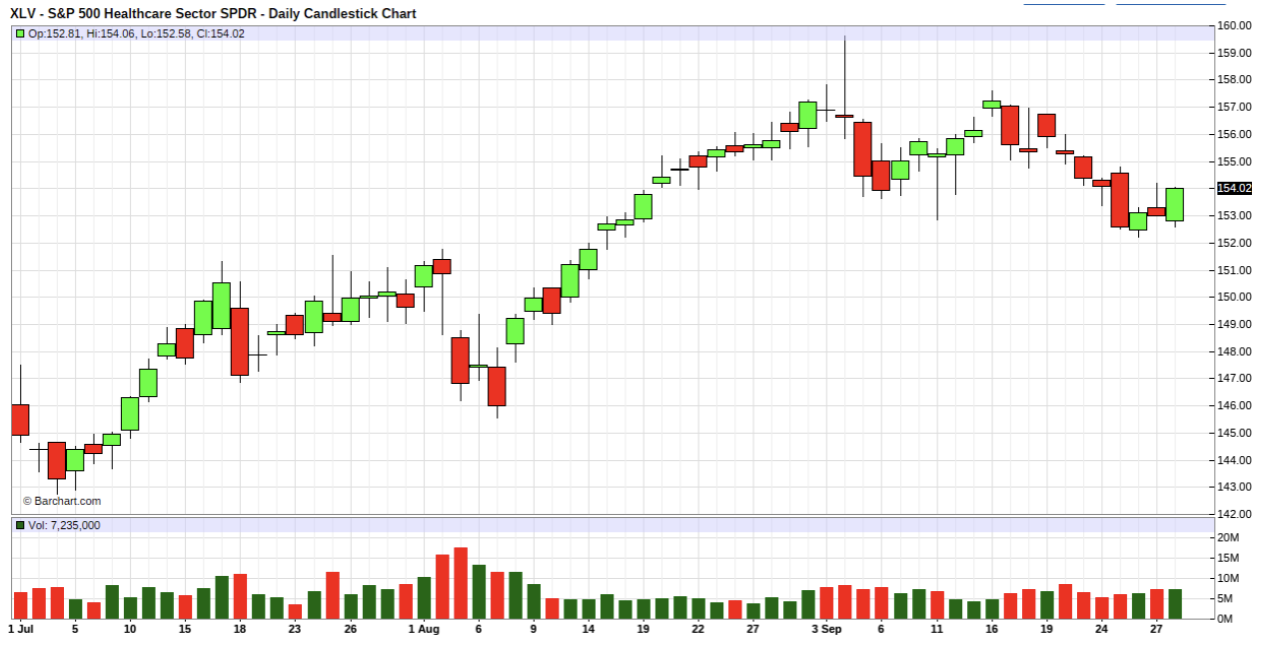
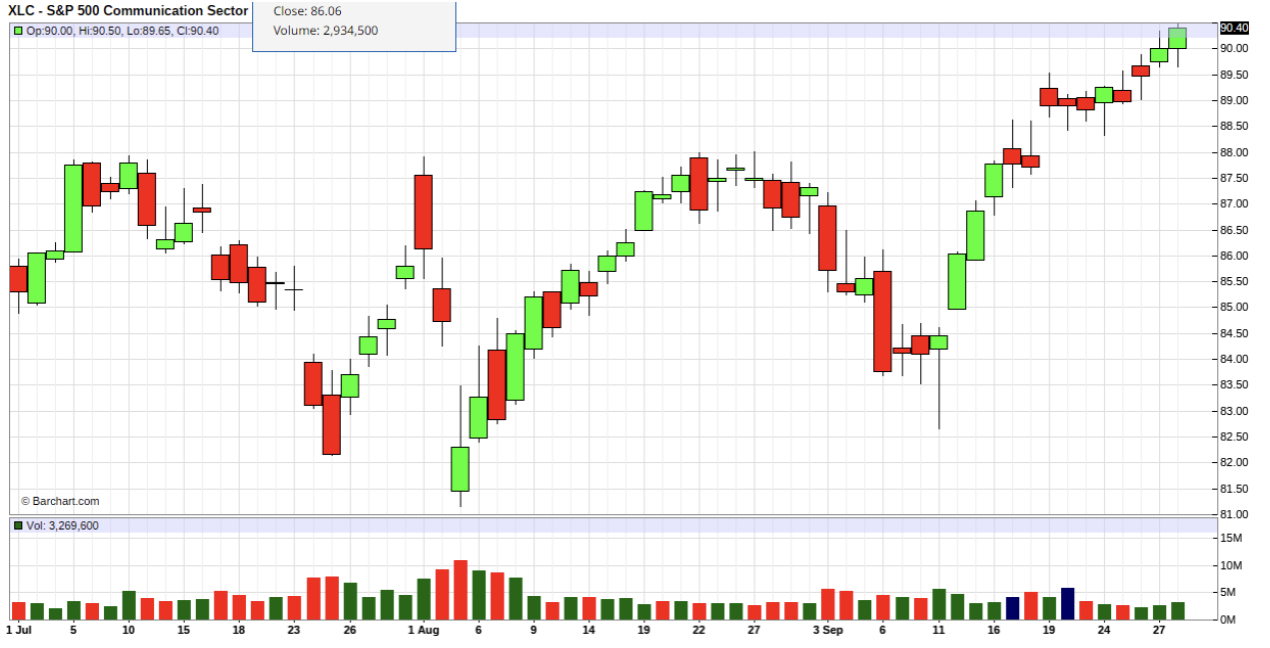
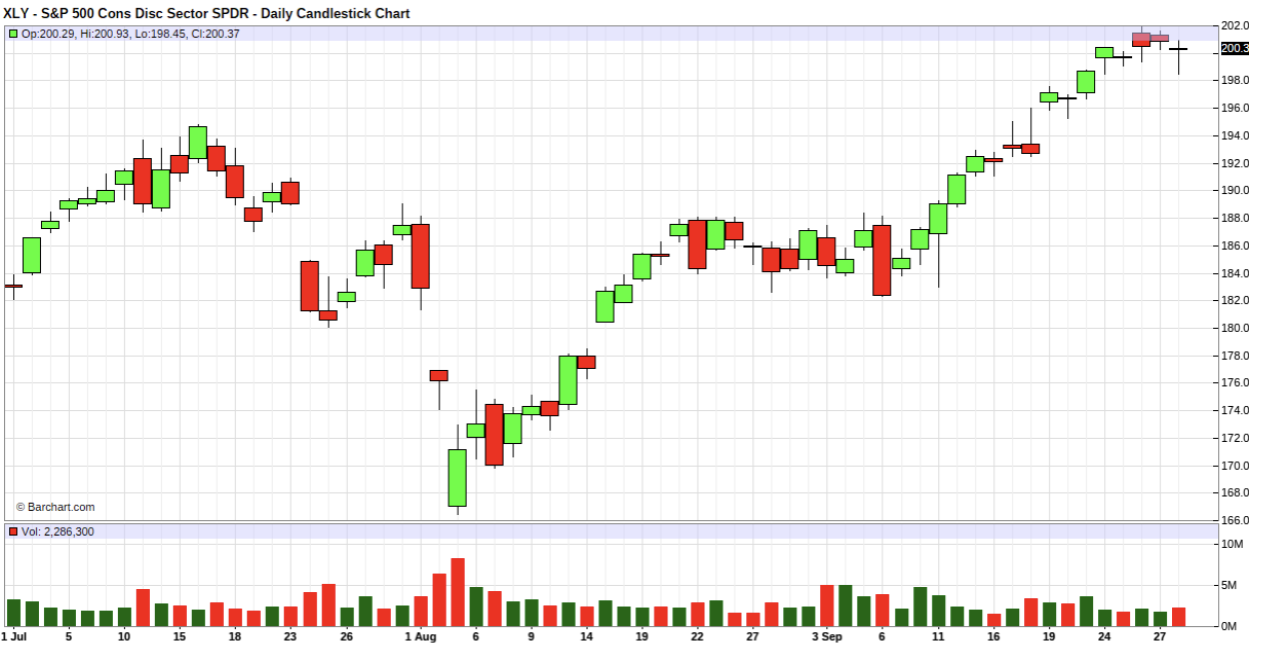
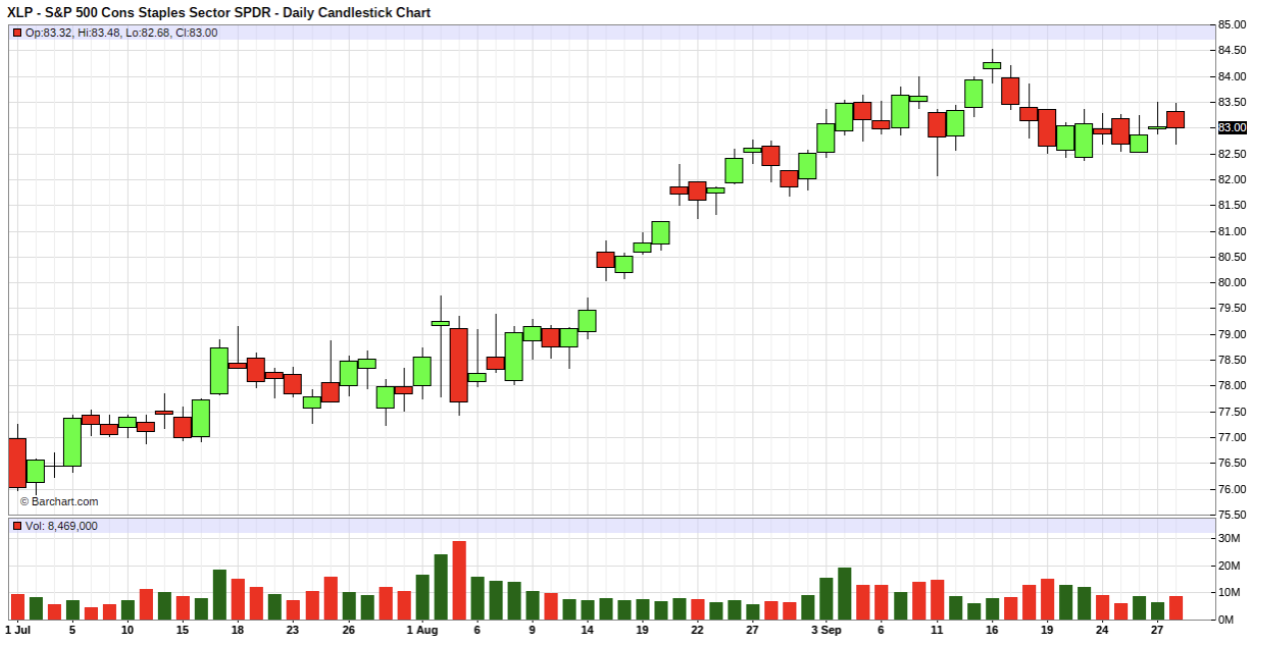
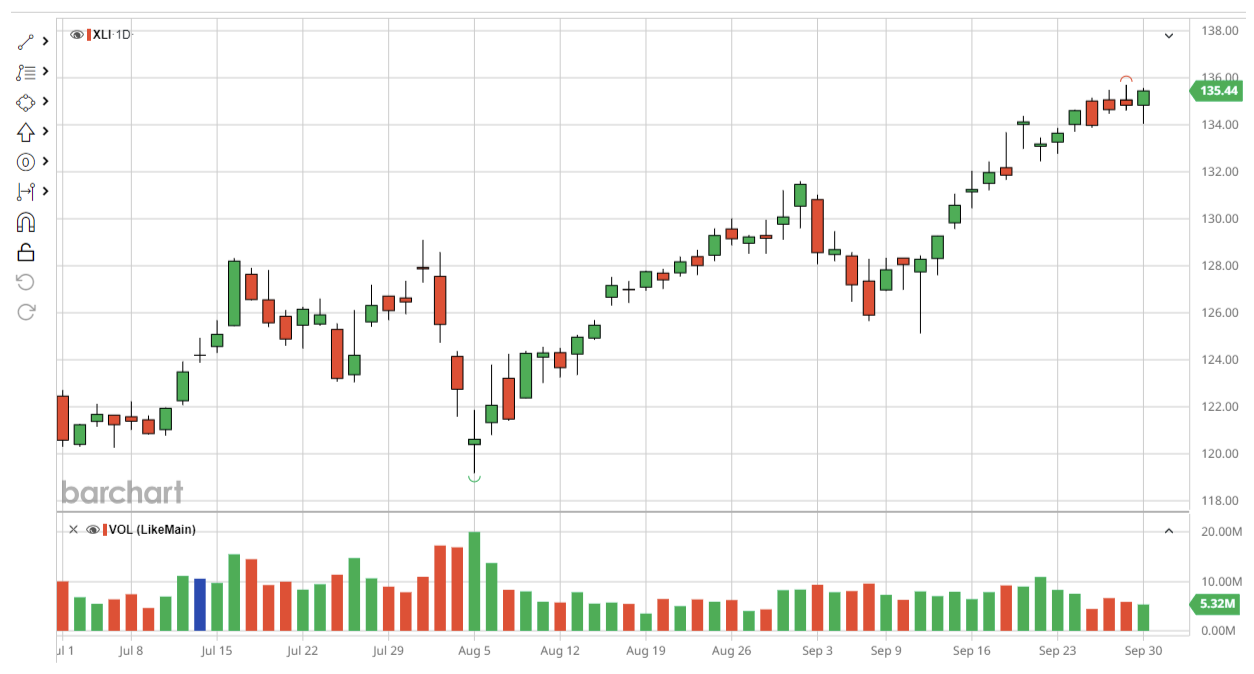
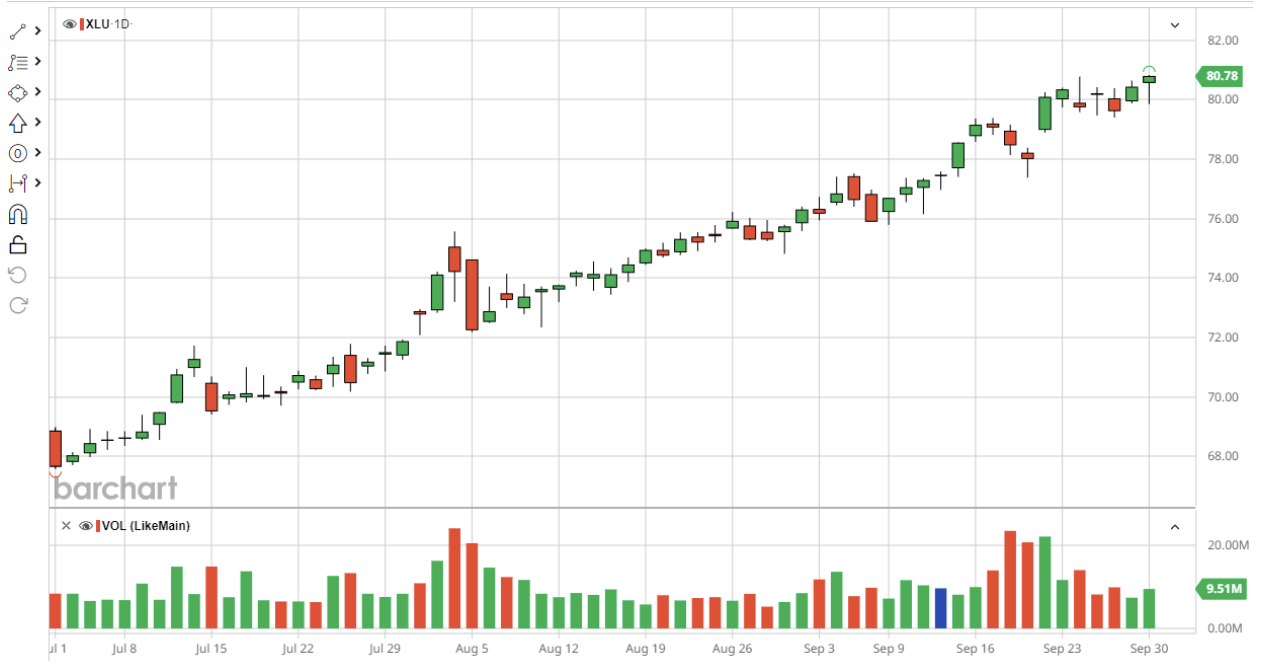
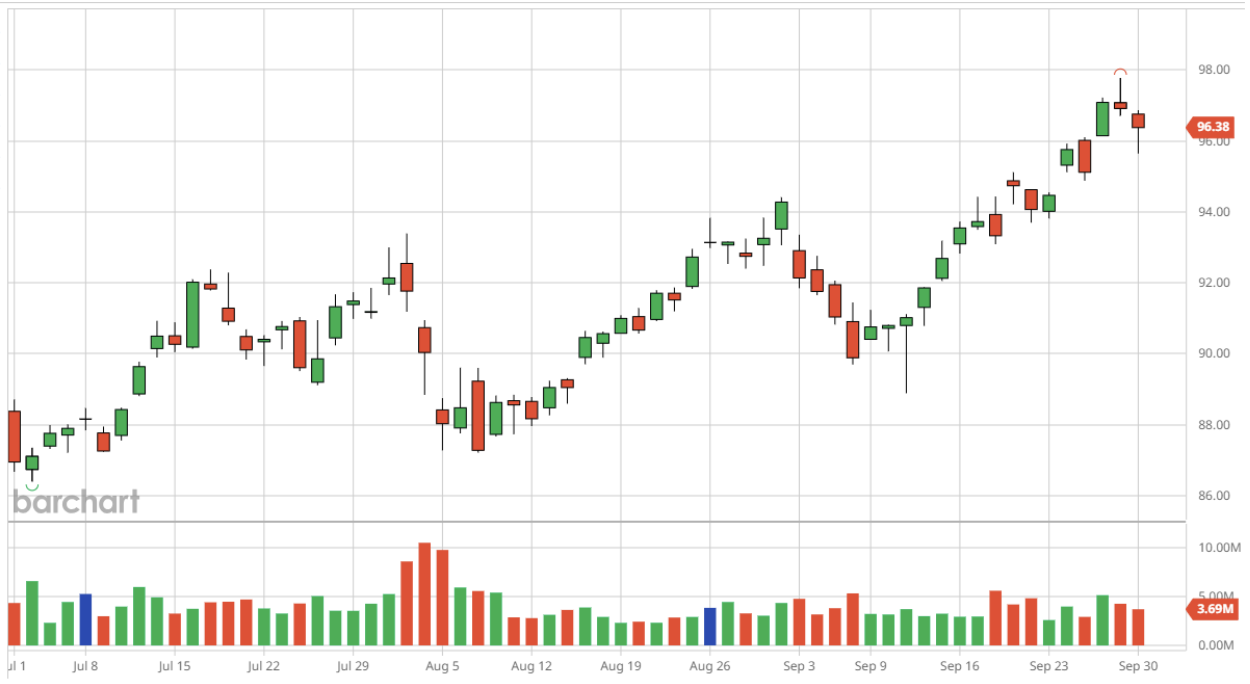
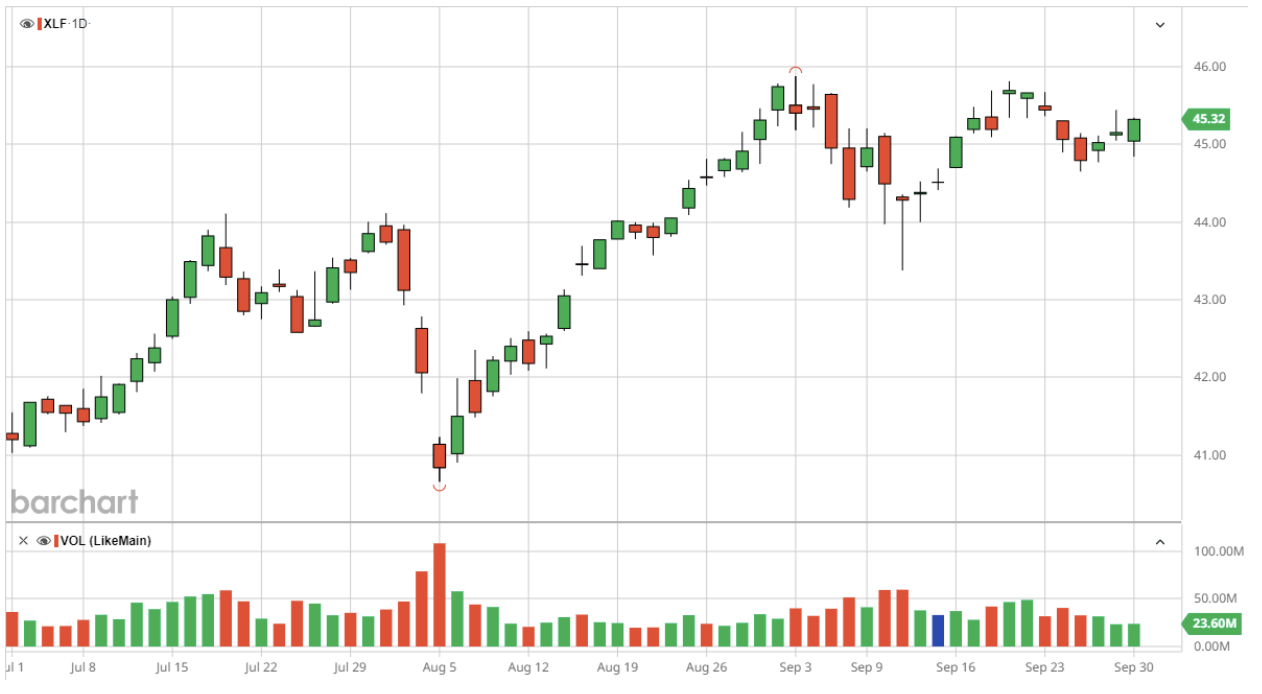
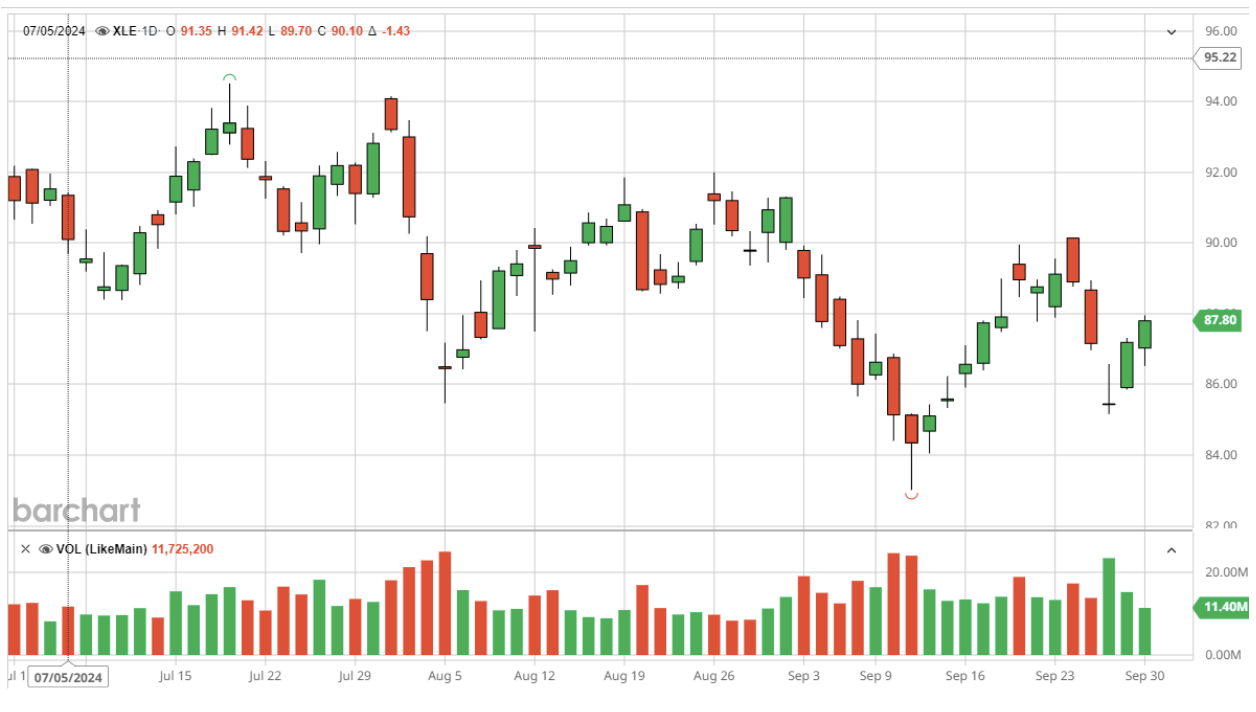
The third quarter of 2024 delivered strong gains across all major U.S. indices, though the Nasdaq lagged behind. The S&P 500 finished the quarter up 5.5%, continuing its momentum with a 20% year-to-date return, while the Nasdaq rose by a more modest 1.59%, contributing to its under 19% year-to-date performance. The Dow Jones outperformed both, gaining 8.21% in Q3. The S&P 500's top-heavy concentration in technology, which saw flat performance for the quarter, meant that nine of its eleven sectors outperformed the broader index. Leading the way were utilities and real estate, which surged 19.4% and 17.1%, respectively, while energy was the only sector in the red, despite a 7.3% gain year-to-date. Source: Bar Charts Several factors drove this robust quarterly performance, including strong corporate earnings and continued enthusiasm for companies involved in artificial intelligence (AI). Disinflation trends and easing monetary policies globally also contributed to market stability, with the Federal Reserve providing an additional tailwind by enacting its first interest rate cut in four years. Despite these positive developments, headwinds remain, particularly for tech-heavy indices like the Nasdaq, as major components like Apple struggled to break above previous highs. Market participants are facing a challenging environment as valuations across nearly all major metrics remain elevated, signaling a frothy market. With the S&P 500's forward P/E ratio, CAPE, price-to-book, and price-to-cash-flow ratios all significantly above their 30-year historical averages, investors are grappling with heightened expectations and a potential disconnect between price levels and underlying fundamentals. As concerns over inflation, interest rates, and economic growth persist, the high valuations across these key metrics add another layer of complexity, forcing market participants to carefully navigate the risks associated with such historically stretched valuations. - The current Forward P/E ratio is 21.52x, which is above the 30-year average of 16.73x. - The current CAPE ratio is 35.24x, which is above the 30-year average of 27.94x. - The current dividend yield is 1.35%, which is 0.64 percentage points below the 30-year average of 1.99%. - The current P/B ratio is 4.47x, which is above the 30-year average of 3.17x. - The current P/CF ratio is 16.50x, which is above the 30-year average of 11.26x. - The current Earnings Yield spread is -1.04%, which is 1.09 percentage points below the 30-year average of 0.05%. These metrics indicate that the market is significantly overvalued relative to its historical averages across most valuation measures. Source: J.P. Morgan Q3 Sector Performances, Valuations, and Investment Thoughts Over the past quarter, Utilities stood out as the top-performing sector, with a remarkable gain of 19.14%, followed closely by Real Estate, which rose by a solid 16.83%. Basic Materials and Financials also delivered strong performance, posting quarterly gains of 9.71% and 9.40%, respectively. Other sectors showing robust growth included Consumer Defensive, Industrials, and Consumer Cyclical, which increased by 9.89%, 9.67%, and 7.42%, respectively. In contrast, the Communication Services and Technology sectors saw more modest gains, rising by only 0.63% and 0.92% for the quarter. Healthcare managed a respectable increase of 5.47%, despite facing short-term challenges. Energy was the weakest sector, declining by 4.01% over the quarter, reflecting the sector's ongoing struggles during this period. Here's a summary of the valuation metrics for the 11 S&P sectors, organized from the most expensive to the cheapest sectors: 1. Real Estate: - P/E: 40.90 (most expensive) - Fwd P/E: 33.12 - PEG: 4.23 - P/S: 4.71 - P/B: 2.47 - P/C: 21.70 - P/FCF: 23.98 Q3 Subcategory Performance: In the Real Estate sector during Q3, Real Estate Holding & Development led the performance with a gain of 26.60%, followed closely by Real Estate Services, which rose 25.15%. Specialty REITs and Retail REITs also showed strong growth, increasing by 19.24% and 17.99%, respectively. On the downside, Hotel & Lodging REITs was the only segment to post a negative return, declining 0.58%, marking it the weakest performer in the Real Estate sector for the quarter. Investment Thoughts: The second best performer in Q3 which is remarkable given its high valuation. However, investors looked past that and welcomed names ahead of the Fed rate cut schedule. We will want to see if there is some sell the news as the Fed gets underway with its cycle. The bottom line, given the big run into the final quarter and the rich valuation, we would prefer to avoid this group. 2. Technology: - P/E: 42.29 (second most expensive) - Fwd P/E: 25.50 - PEG: 2.11 - P/S: 6.75 (highest) - P/B: 7.81 (highest) - P/C: 25.19 - P/FCF: 36.55 (highest) Q3 Subcategory Performance: The technology sector in Q3 showed a mixed performance across different sub-industries. Leading the gains was Computer Services, which surged by 20.31%, followed by Telecommunications Equipment with an 11.58% rise. Electrical Components & Equipment and Renewable Energy Equipment also saw strong performances, gaining 9.58% and 8.24%, respectively. Electronic Equipment posted a 4.85% increase, while Computer Hardware experienced modest gains of 2.87%. However, Software and Semiconductors underperformed, with Software down by 4.31% and Semiconductors taking the biggest hit, falling by 6.32%. Overall, the technology sector demonstrated strength in services and hardware, with significant weakness in semiconductors and software. Investment Thoughts: The XLK is approaching key resistance at the $220 area. Another solid round of earnings may be enough to breakout the group. We would not be surprised to see a strong finish to the year for the tech sector. So we will watch for any pullbacks to buy unless we see a signa; of a failed breakout. 3. Healthcare: - P/E: 39.31 - Fwd P/E: 19.39 - PEG: 2.33 - P/S: 5.07 - P/B: 4.36 - P/C: 15.66 - P/FCF: 22.54 Q3 Subcategory Performance: In Q3, the healthcare sector experienced varied performance across different categories. Health Care Providers led the gains, rising by an impressive 10.69%, followed by Biotechnology, which increased by 8.54%. Medical Equipment also posted a solid gain of 6.21%, while Pharmaceuticals had a modest rise of 1.51%. On the downside, Medical Supplies was the only category to decline, falling by 3.33%, making it the weakest performer in the sector for the quarter. Investment Thoughts: Healthcare names have pulled back to finish as one of the laggards in the markets. The news out on Humana (HUM) and fears around changes in ratings by the CMS promises to be a headwind for a major sector of the group. This will provide headwinds for the sector. If economic data remains strong and investors look for better returns, this is a group that can potentially lag other sectors in Q4. 4. Communication Services: - P/E: 24.82 - Fwd P/E: 18.37 - PEG: 1.41 - P/S: 3.52 - P/B: 4.36 - P/C: 15.66 - P/FCF: 22.54 Q3 Subcategory Performance: The Communication Services sector saw varied performance in Q3. Fixed Line Telecommunications led the gains with a 17.42% increase, followed by Mobile Telecommunications, which rose by 10.57%. Broadcasting & Entertainment also posted solid growth, gaining 5.24%. Other sub-industries, such as Media Agencies and Publishing, had modest gains of 1.87% and 1.10%, respectively. However, Internet stocks underperformed, declining by 0.68%, marking the only negative performance in the sector for the quarter. Overall, the sector exhibited strength in telecommunications and broadcasting, while internet-related stocks faced headwinds. Investment Thoughts: The Communication Services group witnessed a nice breakout at the end of the quarter. The XLC broke out in mid-September and held its ground before marching higher during the final three days of the quarter. This group has strong momentum heading into the final quarter and sets up well for an extension into the end of the year. A key driver is if we see the AI phenomenon work its monetization magic into the group. 5. Consumer Cyclical: - P/E: 24.73 - Fwd P/E: 19.65 - PEG: 1.53 - P/S: 1.74 - P/B: 4.72 - P/C: 10.16 - P/FCF: 31.29 Q3 Subcategory Performance: In Q3, the top-performing sector within Consumer Discretionary was Home Construction, which saw a remarkable gain of 32.78%. Furnishings followed closely with a 26.98% increase, and Home Improvement Retailers posted a strong performance as well, rising by 22.82%. Automobiles and Recreational Products also performed well, gaining 17.53% and 14.17%, respectively. At the other end, the poorest performers were Tires, which suffered a steep decline of 21.25%, making it the worst sector within Consumer Discretionary. Broadline Retailers dropped 1.74%, and Auto Parts also struggled, with a 1.08% decline. These sectors were the main detractors from an otherwise strong quarter for the Consumer Discretionary space. Investment Thoughts: The group has rallied thanks to a push higher in Tesla (TSLA) which remains a significant weighting in the ETF. The Fed rate cut cycle is also providing a tailwind to the sector. However, it will need to see economic data hold steady to avoid some profit taking. We would prefer to wait for a pullback in the group rather than chase. 6. Consumer Defensive: - P/E: 26.66 - Fwd P/E: 19.43 - PEG: 2.33 - P/S: 1.83 - P/B: 4.96 - P/C: 14.63 - P/FCF: 23.42 Q3 Subcategory Performance: In Q3, the Tobacco sector led the Consumer Staples space with an impressive gain of 16.21%. Food Products and Food Retailers & Wholesalers followed closely, both posting strong gains of 11.54% and 11.52%, respectively. Brewers also performed well, increasing by 9.04%, along with Soft Drinks, which rose 8.39%. On the lower end of performance, Drug Retailers saw the smallest increase, gaining only 1.68%. Personal Products and Distillers & Vintners also posted more modest gains of 2.26% and 2.95%, respectively. Overall, the Consumer Staples sector exhibited broad strength, with all sub-sectors posting gains in Q3. Investment Thoughts: The chart highlights the consolidation in the group. A frothy valuation suggests limited upside. There is a defensive nature to the group which makes it appealing in times of uncertainty. But we will want to watch to see how the strikes along the East Coast impact the group. Recall, they operate on tight margins and, as we saw during the pandemic, disruptions to supply chains can have a big impact on this group's margins. This valuation could get a little rich. We would prefer to wait and see how Q3 earnings unfold before chasing these names. 7. Industrials: - P/E: 20.48 - Fwd P/E: 19.61 - PEG: 2.38 - P/S: 2.38 - P/B: 4.84 - P/C: 19.03 - P/FCF: 28.43 Q3 Subcategory Performance: In Q3, the Defense sector led the Industrials with a remarkable gain of 20.69%, followed closely by Building Materials & Fixtures at 19.66%. Other strong performers included Business Support Services and Heavy Construction, both of which saw double-digit percentage gains. On the other end, Delivery Services was the only sector in the Industrial category to post a decline, falling by 2.28%. All other sectors, including Trucking and Marine Transportation, showed positive gains, indicating broad strength across the Industrials. Investment Thoughts: The geopolitical unrest in the Middle East is likely to continue. This should keep defensives in play. If we see signs of tensions easing and economic data weakening, then this group would be susceptible to profit-taking. We would prefer to see a pullback in this group rather than chase. 8. Utilities: - P/E: 21.92 - Fwd P/E: 16.80 - PEG: 2.79 - P/S: 2.42 - P/B: 2.11 - P/C: 26.04 (highest) - P/FCF: 89.73 (highest by a large margin) Q3 Subcategory Performance: In the Utilities sector during Q3, Conventional Electricity was the top performer with a gain of 21.11%, followed by Multiutilities, which increased by 18.01%. Gas Distribution also showed solid growth, rising 14.33%, while Water was the lowest performer within the sector, though it still posted a strong return of 11.18%. Investment Thoughts: This has been a sneaky way of playing the AI trade. Plus it doubles as a safe haven for those worried about a weaker economy. The Fed rate cutting cycle also provides a tail wind as the group's dividends make it an attractive income play. The trend is the friend in this scenario so longs are unlikely to move out of the space any time soon. 9. Basic Materials: - P/E: 23.95 - Fwd P/E: 15.45 - PEG: 2.70 - P/S: 1.86 - P/B: 2.31 - P/C: 13.32 - P/FCF: 23.72 Q3 Subcategory Performance: In the Materials sector during Q3, Gold Mining was the top performer with a significant gain of 24.50%, closely followed by Mining, which rose 24.05%. Other strong performers included Containers & Packaging (13.59%) and Commodity Chemicals (10.11%), showing robust growth across various segments. On the downside, Steel and Aluminum sectors underperformed, with Steel declining by 2.31% and Aluminum down by 1.47%, marking the only negative performers within the Materials sector for the quarter. Investment Thoughts: A nice breakout in the group over the past couple of weeks. This has been driven by the stimulus announcements from China. Investors will want to see these results drive economic data in the region. In addition, it will be important for the U.S. economy to continue to show resilience. If this occurs, then there is room to run in this space. 10. Financial: - P/E: 16.59 - Fwd P/E: 14.09 - PEG: 1.53 - P/S: 2.01 - P/B: 1.87 - P/C: 9.02 - P/FCF: 11.64 Q3 Subcategory Performance: In Q3, the Financial Administration sector led the financial space with an impressive gain of 17.69%, closely followed by Mortgage Finance and Asset Managers, which both rose by 17.35% and 17.19%, respectively. Property & Casualty Insurance and Life Insurance also saw notable gains, increasing by 16.40% and 14.34%. At the lower end of performance, Full Line Insurance was the only sector in the financial space to post a decline, falling by 2.39%. Banks had a modest increase of 1.81%, marking the smallest gain among the positive-performing sectors. Overall, the financial sector experienced broad strength in Q3, with only minor setbacks in specific areas. Investment Thoughts: The Q3 earnings season will be an important driver for the group. The earnings report from Jefferies (JEF) bodes well as it suggests that investment banking units are performing well. The elections should also be a major driver as a Trump victory would signal less regulation of the industry. The Fed rate cutting cycle will factor into Net Interest Income (NII) projections. We would expect firms to drag their feet in terms of providing guidance, citing the uncertainty around the elections. The credit cycles will also be watched with investors paying close attention to comments around reserves. That said, if things line up for the group, there is a breakout potential given the cheap valuations and teh chart setting up for an extension above the $46 level. 11. Energy (cheapest): - P/E: 11.54 (cheapest sector by P/E) - Fwd P/E: 10.50 - PEG: 1.79 - P/S: 1.00 (cheapest by P/S) - P/B: 1.75 (cheapest by P/B) - P/C: 10.50 - P/FCF: 9.68 (cheapest by P/FCF) Q3 Subcategory Performance: In Q3, the Pipelines sector led the Energy space with a strong gain of 10.35%, followed by Coal, which posted an 8.49% increase. Integrated Oil & Gas saw a more modest rise of 0.54%. On the downside, Oil Equipment & Services declined by 5.38%, while Exploration & Production was the worst performer, falling by 6.50%. Overall, the Energy sector displayed a mixed performance, with gains in some areas, but significant declines in others. Investment Thoughts: The cheap valuation and underperformance in Q2 will keep these names on the radar. Economic strength will naturally be a key driver which will have investors watching jobs numbers in the U.S. and the impact of the Chinese stimulus announcements on its economy. In addition to fundamentals, the XLE will need to break above key downtrend resistance around $89 to entice buyers. Q4 Themes to Watch: - Labor Market and Federal Reserve Rate Cuts: Wall Street is closely monitoring labor market data to gauge the Federal Reserve's potential actions regarding future interest rate cuts. A strong labor market could delay cuts, while any signs of weakening might prompt additional easing measures. The performance of the stock market will likely be influenced by how the labor data aligns with expectations for the Fed's monetary policy. The September jobs number will be released this Friday at 8:30am ET. - Economic Growth and Rate-Cutting Cycles: The U.S. economy grew at an estimated 3.1% annual rate in Q3, according to the Atlanta Fed's GDPNow. The first reading on Q3 will be released at the end of October. Historically, rate-cutting cycles have often coincided with recessions, during which the S&P 500 tends to fall in the year following the first cut. However, during soft landings, stocks typically rise, averaging high teen returns, making the trajectory of future rate cuts a critical factor for market performance. - Stock Performance During Rate Cuts: Stocks generally perform well during rate cuts, especially when the economy is not in a recession. However, the upcoming U.S. presidential election and geopolitical risks could increase market volatility. Contrary to conventional wisdom, large-cap stocks have historically outperformed small-cap stocks during rate-cutting cycles, especially outside of recessions. Sectors such as healthcare and consumer staples have tended to benefit most, while communication services and technology often lag. - Political Volatility: Political developments, including the upcoming U.S. presidential election, are likely to amplify stock volatility through the end of the year. While the market's initial reaction to elections is often not indicative of longer-term performance, the candidates' positions on tariffs and corporate taxes could have lasting implications for U.S. businesses if enacted, adding further uncertainty to market conditions. - Earnings and the Magnificent Seven: The S&P 500, excluding the Magnificent Seven (top tech stocks), saw aggregate earnings growth in Q2 for the first time since 2022. Q3 results are expected to continue narrowing the profitability gap between tech mega caps and the rest of the market. However, the Magnificent Seven face pressure to prove that their significant investments in AI will deliver returns, after struggling to meet Wall Street's high expectations over the summer. Further underperformance could keep these stocks under pressure. - Geopolitical Risks and Market Volatility: Conflicts in the Middle East and Ukraine could maintain stock market volatility, particularly if they threaten to disrupt global trade or energy markets. Heightened volatility presents opportunities for investors, as periods of high market stress can lead to attractive valuations. Historically, when the Cboe Volatility Index has risen above 29, the S&P 500 has delivered significantly higher returns in the following six months, providing potential upside for those able to navigate the uncertainty.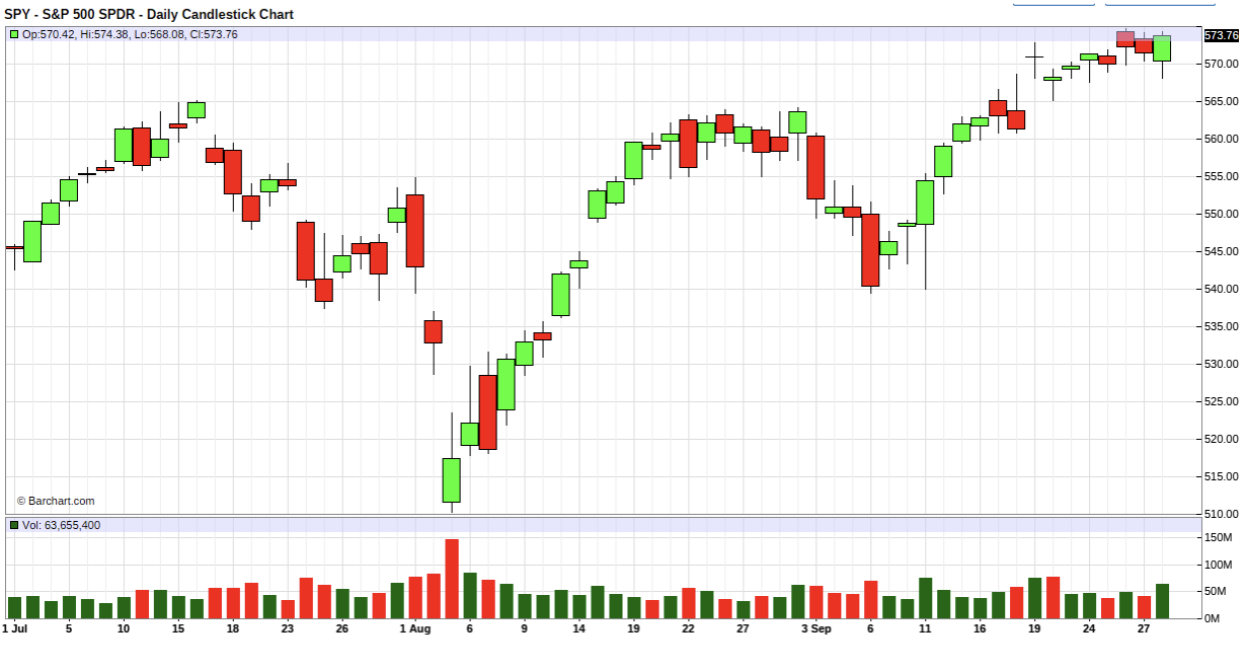
Unlock Market-Moving Insights.
Subscribe to PRO Articles.
Already have an account? Sign in
Unlock Market-Moving Insights.
Subscribe to PRO Articles.
Already have an account? Sign in
