
PUMP's Deepening Correction and Support Testing: Short-Term Reversal Opportunities Amid Institutional Accumulation
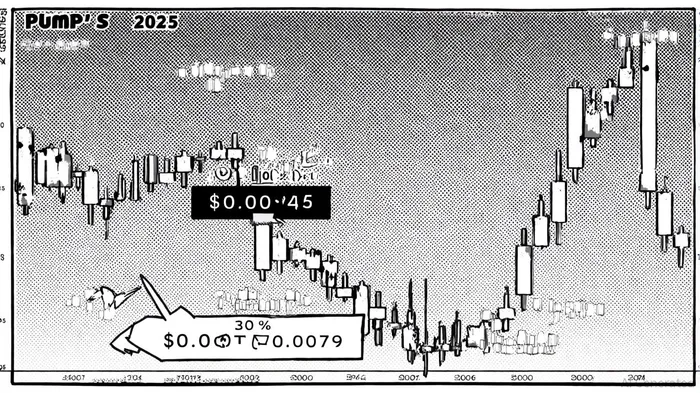
The PUMP token has entered a critical phase of its price trajectory, marked by a deepening correction and intense testing of key support levels. As of September 19, 2025, PUMP trades at $0.0079, down 30% from its all-time high of $0.0090, raising questions about whether this represents a buying opportunity or a bearish breakdown. However, a closer examination of technical indicators, on-chain accumulation patterns, and institutional buying activity reveals a nuanced picture: while short-term risks persist, structural support from large holders and strategic buybacks may catalyze a reversal.
Correction Dynamics and Support-Level Resilience
PUMP's recent pullback has been driven by weakening momentum, as evidenced by its Relative Strength Index (RSI) slipping from overbought territory (above 70) to neutral levels, and a MACD histogram nearing a bearish crossover [1]. The critical support level at $0.0062 now acts as a psychological floor; a breach here could trigger further declines toward $0.002435, a level last tested during a 15% downturn in early September [3]. Conversely, stabilization above $0.0074 could reignite bullish momentum, with a double-bottom pattern suggesting a potential breakout target of $0.0100 [1].
Historical data from 40 MACD Death Cross events since 2022 reveals mixed outcomes: while PUMP underperformed slightly in the first two days (≈ -0.1%), the mean excess return by day 30 was ~ +1.4%, albeit statistically insignificant. The win rate for these events oscillated between 50–60%, indicating no strong directional edge . This suggests that while the current bearish divergence in the MACD histogram raises caution, past signals have notNOT-- reliably predicted sustained declines.
What makes this correction noteworthy is the on-chain accumulation occurring at these support levels. A $26.08 million net inflow on September 11—coinciding with PUMP's dip to $0.0072—signals renewed conviction among traders [4]. More recently, a whale purchased 1.1 billion PUMP tokens for $8 million in USDCUSDC-- at an average price of $0.0072, directly at a key support level [2]. This strategic accumulation, tracked by on-chain analytics platforms like Nansen, underscores institutional confidence in PUMP's long-term value proposition.
Institutional Buying: A Tailwind for PUMP
While PUMP itself is not a top-10 cryptocurrency, broader institutional flows in the crypto market provide indirect tailwinds. September 2025 has seen record inflows into BitcoinBTC-- (BTC) and EthereumETH-- (ETH) ETFs, with U.S. spot Bitcoin ETFs alone attracting $553 million on September 12 alone [5]. These trends reflect a broader institutional appetite for digital assets, which often spills over into smaller-cap tokens like PUMP.
PUMP's own buyback program further aligns with institutional-grade strategies. Since July 2025, the project has repurchased $103.76 million worth of tokens, reducing circulating supply by 6.898% [4]. This supply contraction—combined with the recent $12.2 million buyback post-Binance US listing—creates upward pressure, particularly if institutional investors view PUMP as a speculative play with high leverage to macro trends [5].
Short-Term Reversal Signals: Volume and Divergences
For traders seeking entry points during PUMP's correction, volume spikes and bullish divergences offer actionable signals. On September 11, volume surged 200% above the 30-day average as PUMP tested $0.0072, a classic sign of accumulation [1]. Similarly, the whale's $8 million purchase on September 20 added another volume spike at $0.0072, reinforcing the level's significance [2].
Technical indicators also hint at a potential reversal. The Commodity Channel Index (CCI) has shown a bullish divergence, with price making lower lows while CCI forms higher lows—a precursor to upward momentum [4]. Meanwhile, the On-Balance Volume (OBV) has stabilized, suggesting that selling pressure may be exhausting [1]. If PUMP closes above $0.0074 in the coming days, these signals could validate a short-term rebound.
Risks and the Path Forward
Despite these positives, risks remain. A breakdown below $0.0062 could trigger a cascade of liquidations, given PUMP's high leverage and retail-heavy investor base [3]. Additionally, broader market sentiment—while bullish for BTCBTC-- and ETH—remains fragile, with altcoin open interest (OI) at $1.1 billion reflecting speculative fragility [6].
However, the confluence of institutional accumulation at support levels, aggressive buybacks, and bullish on-chain signals suggests that PUMP's correction may already be pricing in much of its downside. For investors with a medium-term horizon, a rebound above $0.0074 could mark the start of a new bullish phase, potentially testing the $0.0090 psychological barrier and beyond.


Comentarios
Aún no hay comentarios