
Pudgy Penguins (PENGU) and the Strategic Case for Buying at Key Support: Short-Term Technical Reversal and Bullish Momentum Confirmation
Price Action and Market Context
PENGU's recent 12.8% price surge over 24 hours on November 10, 2025, was fueled by a broader BitcoinBTC-- rebound and a 3.74% rise in altcoin market cap according to reports. However, the token has faced bearish pressure since peaking on October 27, declining 28.5% and falling below the 78.6% Fibonacci retracement level at $0.016 as data shows. This breakdown has created an "imbalance zone" acting as overhead resistance, but it also highlights a key opportunity for contrarian traders.
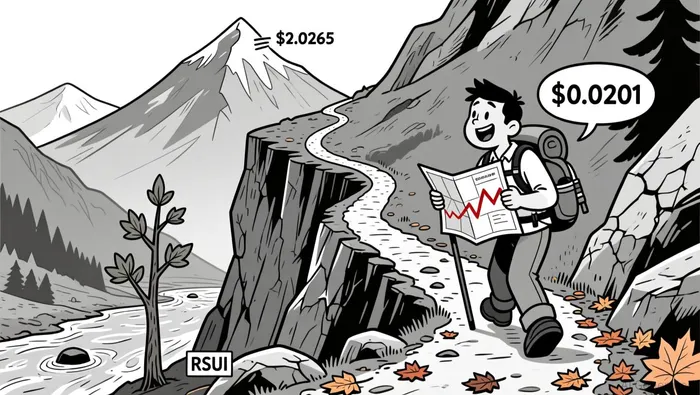
The token's current price of $0.0216 sits within a descending triangle pattern, with support near $0.0201 and resistance at $0.0265 according to analysis. Analysts project a potential 30% upward move if PENGUPENGU-- breaches the $0.0265 resistance, a scenario that would align with the pattern's technical implications. Meanwhile, derivatives data show stable open interest ($110.53 million) and a balanced long-to-short ratio, suggesting market participants are not yet overcommitted to either side as indicators suggest.
Technical Indicators and Momentum Signals
The 14-day RSI for PENGU/USD stands at 52.917, indicating neutral market conditions according to data. However, recent on-chain activity reveals a critical divergence: while PENGU's price tested $0.0201, the RSI-7 dipped to 26.57 (oversold territory), and the MACD histogram turned positive for the first time in weeks according to analysis. This divergence-a hallmark of potential reversals-suggests weakening bearish momentumMMT-- and hints at a short-term recovery.
The $0.0201 support level is reinforced by Fibonacci retracement levels at $0.017920 (0.618) and $0.013920 (0.786) as technical indicators show. A successful defense of $0.0201 could trigger a retest of the 7-day SMA ($0.0139), further validating a bullish reversal. Conversely, a breakdown below $0.0201 could expose PENGU to a steep decline toward $0.009 as the pattern suggests.
On-Chain and Market Fundamentals
Beyond technicals, on-chain data underscores PENGU's strategic appeal. Fresh inflows of $1.8 million and rising whale participation indicate strong accumulation behind the $0.0201 support according to data. Additionally, the token's ecosystem is expanding through Web3 partnerships, which could drive renewed interest and liquidity as reports indicate.
Derivatives metrics further support a cautious bullish case: open interest has increased by 1.89% to $110.53 million, and the long-to-short ratio remains balanced according to analysis. These signals suggest that while bearish sentiment persists, the market is not yet oversold, creating fertile ground for a short-term rebound.
Risks and Alternatives
Critics argue that PENGU's "strong sell" signal from moving averages and its underperformance relative to broader altcoin trends pose risks according to technical analysis. A failure to reclaim $0.0201 could trigger a cascade of stop-loss orders, accelerating the decline toward $0.009 as indicators suggest. Traders should also monitor Bitcoin's price action, as PENGU's performance remains tied to the broader market's risk-on/risk-off sentiment.
Conclusion: A Strategic Buy at Key Support
The confluence of technical, on-chain, and market factors makes a compelling case for buying PENGU at $0.0201. The RSI divergence and MACD histogram reversal suggest weakening bearish momentum, while the descending triangle pattern and Fibonacci levels provide a clear roadmap for potential price targets. For traders with a short-term horizon, this support level represents a high-probability entry point, offering a risk-reward profile that aligns with the token's structural setup.
However, as with all high-volatility assets, caution is warranted. Position sizing and stop-loss placement near $0.0179 are critical to managing downside risk. If PENGU successfully defends $0.0201 and breaks above $0.0265, it could unlock a 30% rally to $0.027, validating the bullish case.


Comentarios
Aún no hay comentarios