
Near Protocol (NEAR) Revisits Key Breakout Level: A High-Probability Bounce or Bearish Reversal?
NEAR Protocol (NEAR) has once again drawn attention as it hovers near critical price levels in September 2025, sparking debates among traders and analysts about whether this is a high-probability bounce or the onset of a bearish reversal. With the token trading at $2.33 in early September and fluctuating amid macroeconomic pressures[1], the interplay of technical indicators and on-chain metrics offers a nuanced view of its trajectory.
Technical Analysis: A Tug-of-War at Key Levels
NEAR's price action reveals a delicate balance between bullish and bearish forces. The Relative Strength Index (RSI) currently sits at 55[1], indicating neutral market conditions, while the MACD shows fading bullish momentum[1]. Bollinger Bands, however, suggest moderate volatility and a potential consolidation phase or breakout[1].
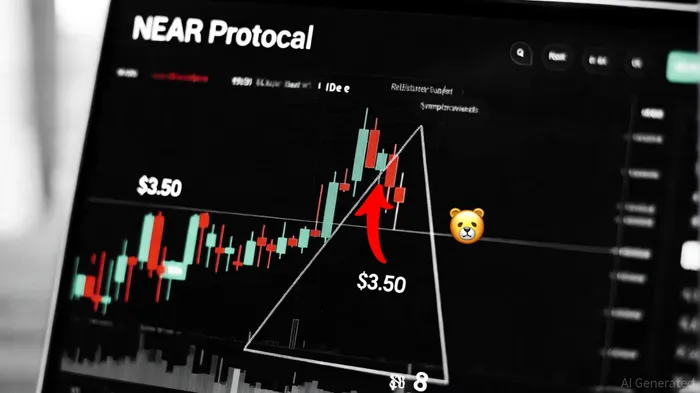
A critical juncture lies at $3.50, a level that, if breached, could trigger a rally toward $8[3]. Analysts have noted a clean symmetrical triangle breakout on the daily chart, with a target of $3.50 and an extended projection of $8[3]. Conversely, a failure to hold above $2.80 could see the price retest lower support levels at $2.40 and $2.20[2].
The on-chain data adds further complexity. Short position liquidations in Q3 totaled $1.44 million[3], signaling growing bearish risk. Meanwhile, the price's recent surge to $3.20—a 15% increase in 24 hours—has drawn comparisons to a Head and Shoulders bottom pattern, with some analysts projecting a move toward $6–$9[1]. However, historical backtesting of similar Head and Shoulders bottom patterns from 2022 to 2025 reveals mixed results. A 30-day hold following 12 detected breakouts yielded a median return of approximately -2.5%, with a win rate of around one-third[1]. Early momentum (days 5-10) showed modest gains, but returns decayed thereafter, suggesting that shorter holding periods may be more effective than a fixed 30-day strategy[1].
On-Chain Behavior: Volume, Adoption, and Sentiment
NEAR's on-chain activity underscores its growing adoption. As of September 9, 2025, the network reported 3.1 million daily active addresses, second only to BNBBNB-- Chain[1]. This surge coincided with the Intents product crossing $1 billion in all-time transaction volume[1], a testament to its cross-chain and AI-driven use cases. Total Value Locked (TVL) also surpassed $15 million[1], reflecting increased institutional interest.
Futures market metrics provide additional insights. Open Interest (OI) in NEAR's perpetual contracts reached $485 million[3], while funding rates and liquidations suggest a shift in risk exposure. Rising OI and short liquidations indicate a potential short-covering rally[3], but traders must remain cautious about overextended positions.
Market Context: AI Integration and Competitive Dynamics
NEAR's strategic alignment with the AI narrative has bolstered its appeal. The recent integration with Allora Network to enhance predictive AI capabilities[5] positions the protocol as a key player in the AI-focused blockchain sector. However, the broader market remains fragile, with NEAR dipping to $2.88 amid systemic weakness on September 22[2].
Risk Factors and Projections
While bullish scenarios hinge on a breakout above $3.50, bearish risks persist. A failure to sustain momentum could see the price retrace to $2.20, with the RSI and MACD likely to signal bearish divergence. Analysts like Crypto NL have projected a surge toward $38–$40[4], though such a move would require unprecedented macroeconomic and sectoral tailwinds.
Conclusion: A High-Probability Bounce with Caveats
NEAR's current positioning suggests a high-probability bounce, supported by on-chain adoption, AI-driven use cases, and technical patterns. However, the bearish reversal risk remains non-trivial, particularly if macroeconomic pressures intensify. Traders should monitor the $3.50 level closely, with stop-loss orders below $2.80 to mitigate downside risk. For now, NEAR's trajectory appears poised between innovation and volatility—a classic test of resilience in the crypto markets.


Comentarios
Aún no hay comentarios