
Post-Crash Crypto Market Recovery: Decoding Historical Patterns, Investor Behavior, and On-Chain Metrics
Historical Patterns: Timeframes and Catalysts
Cryptocurrency recoveries are rarely linear. The 2013 cycle, for instance, saw BitcoinBTC-- plummet from $1,150 to $200 by 2015, with recovery driven by early-stage adoption and renewed retail interest, according to a BlockTechBuzz analysis. The 2017 bull run, which peaked at $20,000, was followed by a 2018 correction to $3,200, fueled by the ICO boom and regulatory crackdowns, as the BlockTechBuzz piece notes. By contrast, the 2021–2022 cycle-marked by a peak of $69,000 for Bitcoin and a trough of $17,500-showed partial recovery in 2023, buoyed by Ethereum's 2.0 upgrade and macroeconomic shifts, which the BlockTechBuzz analysis attributes to a mix of technological and macro factors.
A recurring theme is the Bitcoin halving event, which occurs every four years. Historically, these events have reduced supply and increased scarcity, often acting as catalysts for bullish trends, an observation also highlighted in the BlockTechBuzz analysis. For example, the 2020 halving preceded Bitcoin's 2021 surge, suggesting a potential correlation between supply constraints and price action.
Investor Behavior: Institutional Adoption and Retail Dynamics
Institutional adoption has emerged as a cornerstone of modern crypto recoveries. The introduction of U.S. spot Bitcoin and EthereumETH-- ETFs in 2025 injected over $28 billion in inflows, anchoring liquidity and creating structural demand, according to Binance Research charts. Public companies now hold approximately 1.07 million BTC and 4.36 million ETH, reflecting broader institutional confidence, as shown in the Binance Research charts. Unlike speculative flows, this demand contributes to more stable market conditions, reducing volatility during recovery phases.
Retail investor behavior has also evolved. From 2017 to 2025, crypto adoption among U.S. households increased steadily, with 17% of active Chase checking account users investing in crypto assets, according to a JPMorgan Chase report. However, adoption remains concentrated among younger demographics and high-income individuals. Flows into crypto accounts often accelerate during Bitcoin price surges, as seen in March and November 2024, a pattern the JPMorgan Chase report highlights. These behavioral patterns align with on-chain activity, such as spikes in stablecoin inflows to exchanges, which frequently precede price rallies, as identified by top on-chain indicators.
On-Chain Metrics: The Data-Driven Lens
On-chain metrics provide granular insights into market sentiment and network health. Key indicators include:
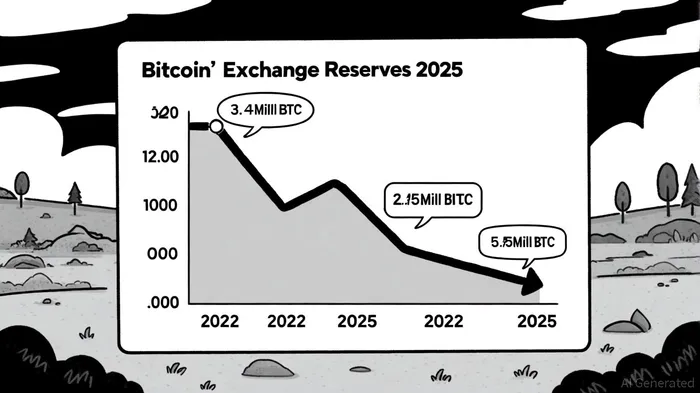
- Exchange Reserves: Bitcoin's exchange reserves have declined from 3.4 million BTC in 2022 to below 2.5 million BTC by mid-2025, signaling strong outflows into cold storage and long-term accumulation, a trend documented by the BlockTechBuzz analysis. This scarcity has amplified upward price movements during bullish periods.
- HODL Waves: A rise in long-term holdings (e.g., coins held for seven years) indicates a growing base of committed investors, a pattern also noted in the JPMorgan Chase report.
- NVT Ratio (Network Value to Transactions): This metric helps assess whether an asset is overvalued or undervalued relative to its transaction volume, as discussed in the BlockTechBuzz piece.
- MVRV Z-Score: A measure of realized vs. market value, it identifies overvaluation or undervaluation thresholds, another indicator explored in the BlockTechBuzz analysis.
For example, Ethereum's exchange reserves have stabilized, suggesting holders may be waiting for clearer market signals before taking action, an observation made in the BlockTechBuzz analysis. Meanwhile, rising active addresses and hash rates-reflecting network participation and miner confidence-correlate with price increases, a relationship the JPMorgan Chase report documents.
Synthesis: Integrating Signals for Informed Decisions
The convergence of historical patterns, investor behavior, and on-chain metrics paints a nuanced picture of recovery dynamics. For instance, the 2023 rebound followed a period of accumulation by long-term holders, as evidenced by declining exchange reserves and rising HODL waves, a trend the BlockTechBuzz analysis highlights. Similarly, the 2025 ETF-driven inflows align with institutional adoption trends observed in prior cycles and reflected in the Binance Research charts.
However, challenges persist. Regulatory uncertainty and macroeconomic headwinds could delay recovery timelines, particularly in emerging markets where adoption is still nascent, a risk also noted in the Binance Research charts. Investors must also remain cautious of speculative bubbles, as seen during the 2017 ICO boom, which the BlockTechBuzz analysis discusses.
Conclusion: Navigating the Path Forward
Post-crash recoveries in crypto markets are shaped by a complex interplay of factors. Historical cycles provide a framework for understanding timeframes and catalysts, while investor behavior and on-chain metrics offer real-time signals. As the market matures, the integration of diverse data sources-technical indicators, blockchain analytics, and macroeconomic trends-will become increasingly vital for accurate forecasting, a point emphasized in the BlockTechBuzz analysis.
For investors, the key lies in balancing patience with agility. Accumulation phases, though often prolonged, present opportunities for those who can discern genuine value from noise. As the 2025 market evolves, the lessons of the past will remain a compass for navigating the future.


Comentarios
Aún no hay comentarios