
Pi Coin's Fibonacci Confluence and Short-Term Recovery Potential
In the ever-evolving landscape of cryptocurrency, Pi Coin (PI) has emerged as a subject of both optimism and skepticism. As of November 25, 2025, Pi Network's price action has entered a critical juncture, with technical indicators and Fibonacci retracement levels suggesting a potential inflection point. This analysis explores the interplay between Fibonacci confluence, momentum metrics, and investor psychology to assess Pi Coin's short-term recovery prospects.
Technical Momentum and Fibonacci Confluence
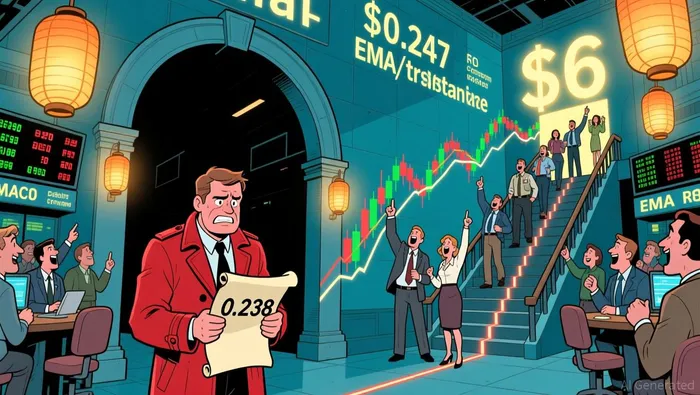
Pi Coin's price has consolidated within a symmetrical triangle pattern, with the 38.2% Fibonacci retracement level at $0.247 serving as a pivotal resistance zone. This level coincides with the 50-day exponential moving average (EMA) and a descending trendline, creating a rare confluence of support/resistance that could catalyze a breakout. On November 25, 2025, the price stood at $0.238, just 3.7% below this critical threshold.
 Momentum indicators reinforce the case for a bullish reversal. The RSI has climbed to 56, signaling strengthening upward momentum, while the MACD has shown a bullish crossover since late October 2025. These signals suggest that buyers may soon overpower sellers, particularly if the price breaches the triangle's apex. Fibonacci extensions project potential targets beyond $1.78, with a final extension hinting at $1.87–$1.90. However, a breakdown below the triangle could push the price toward the 0.618 Fibonacci level at $1.13, invalidating the bullish scenario.
The Chaikin Money Flow (CMF) indicator, currently below the zero line, indicates outflows dominate the market, reflecting weak investor confidence. Yet, the Squeeze Momentum Indicator is building a squeeze, suggesting explosive price movements could follow if optimism resurges. This duality underscores the delicate balance between caution and opportunity in Pi Coin's near-term trajectory.
Investor Psychology and Market Sentiment
While technical indicators provide a structural framework, investor psychology remains a wildcard. Despite the absence of direct sentiment data from social media or forums, the interplay between Fibonacci levels and momentum metrics indirectly reflects market behavior. For instance, the CMF's negative reading suggests retail and institutional investors are liquidating positions, a psychological shift that could delay a breakout. Conversely, the MACD's bullish crossover and RSI's upward trajectory may attract algorithmic traders and short-term speculators, amplifying volatility.
CoinCodex warns of a potential drop to $0.181248 by November 24, 2025, highlighting the fragility of Pi Coin's recovery narrative. This prediction, rooted in technical indicators and market sentiment, underscores the importance of monitoring volume and order flow to gauge conviction behind price movements.
Risk and Strategic Considerations
Investors must weigh the risks of a breakdown against the rewards of a breakout. A successful breach of the $0.247 resistance could trigger a cascade of stop-loss orders and institutional buying, propelling Pi Coin toward its Fibonacci extension targets. However, a failure to hold above the 0.618 level at $1.13 would likely reignite bearish sentiment, exacerbating downward pressure. Strategically, traders might consider a range-bound approach until the triangle resolves, with tight stop-loss orders below key support levels. Long-term holders, meanwhile, should remain cautious, as the CMF's negative trend suggests broader market skepticism.
Conclusion
Pi Coin's technical landscape in November 2025 presents a compelling case for short-term recovery, driven by Fibonacci confluence and improving momentum indicators. However, the absence of robust investor sentiment data and the CMF's bearish signal highlight the need for vigilance. As the market approaches the triangle's apex, the interplay between technical structure and psychological dynamics will determine whether Pi Coin transitions from consolidation to conviction-or succumbs to renewed bearishness.


Comentarios
Aún no hay comentarios