
PEPE's Potential Reaccumulation Pattern After a 27.5% Weekly Drop: A Technical Analysis and Strategic Entry Guide
Introduction
The PEPEPEPE-- token, a memecoinMEME-- with no intrinsic utility, has faced a 27.5% weekly price drop in early October 2025, bringing its value to $0.000007[1]. This sharp correction, part of a broader market pullback in the memecoin sector[3], has sparked debates about whether the decline signals a bearish reversal or a reaccumulation phase. Technical analysis and on-chain data suggest a complex interplay of bearish exhaustion and potential bullish setup, making strategic entry timing critical for investors.
Technical Analysis: Bearish Exhaustion and Oversold Conditions
PEPE's price has been trading below its key moving averages (MA-20, MA-50, and MA-200), reflecting sustained seller pressure[3]. However, the Relative Strength Index (RSI) has dipped to 34.80, indicating an oversold condition[3], while the Stochastic RSI remains neutral. This divergence between price action and momentum indicators often precedes reversals.
Fibonacci retracement levels further highlight critical junctures. The 0.5 retracement level at $0.000018136 and the Value Area Low (VAL) have acted as crucial supports[1]. A breakdown below these levels could trigger a deeper decline toward $0.0000032[1], but a higher low formation might validate a double-bottom pattern, signaling a bullish reversal[1].
Reaccumulation Pattern: Consolidation and Whale Accumulation
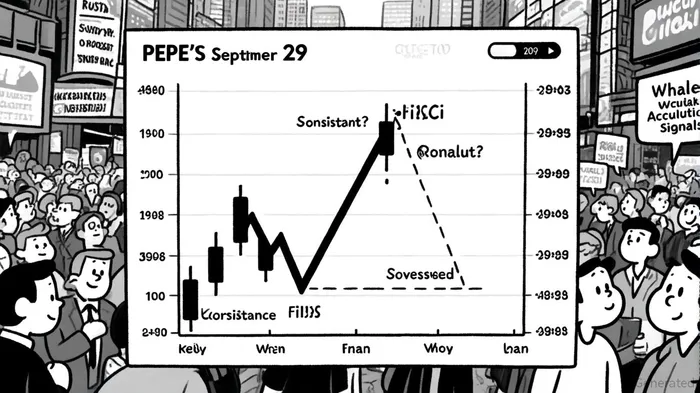
Post-October 2025, PEPE has consolidated between $0.00000720 and $0.00000740, with on-chain data revealing increased whale accumulation[3]. Large investors have been buying during dips, suggesting long-term confidence in the token's speculative narrative[3]. This accumulation coincides with a potential reaccumulation pattern under a descending triangle, where price action forms a rounded base[1].
The descending triangle breakout on September 29 initiated a bullish cycle, peaking at $0.000025 on November 14[4]. If PEPE sustains above $0.00000720, it could retest the 0.618 Fibonacci extension at $0.000028983[2], a level critical for confirming a Wave 5 continuation in Elliott Wave analysis[2].
Strategic Entry Levels and Risk Management
For traders considering entry, key support zones at $0.00000720 and $0.00000716[1] offer high-probability buy opportunities if the price holds. Immediate resistance lies at $0.00000737[3], with a successful breakout potentially unlocking targets at $0.00000740 and beyond.
A 28% gain from current levels is possible if PEPE breaks above $0.00000732, aligning with previous swing highs[5]. However, risks remain: a breakdown below $0.00000698[3] could invalidate the bullish case, forcing the price toward $0.0000032[1]. Position sizing and stop-loss placement near $0.00000698 are essential to mitigate downside risk.
Market Sentiment and Broader Implications
Despite PEPE's technical setup, the broader crypto Fear & Greed index at 64 (Greed) indicates optimism[1], which could fuel retail-driven rallies. However, PEPE's reliance on virality and social media trends makes it highly volatile[1]. A 796% rally by year-end, as suggested by some Fibonacci extensions[3], hinges on sustained retail participation and memeMEME-- coin relevance.
Conclusion
PEPE's post-27.5% drop reaccumulation pattern presents a high-risk, high-reward scenario. Technical indicators suggest a potential bullish reversal if key supports hold and the RSI remains elevated[4]. Whale accumulation and Fibonacci targets offer a roadmap for strategic entries, but investors must remain cautious of the token's speculative nature. As the market tests $0.00000720, the coming weeks will be pivotal in determining whether PEPE transitions from bearish exhaustion to a new bullish cycle.


Comentarios
Aún no hay comentarios