
PEPE's Critical Support Level and Implications for Short-Term Volatility
The meme coin market has always been a high-stakes arena, and PEPE’s current price action underscores the volatility inherent in altcoin trading. As the token tests critical support levels in September 2025, technical and on-chain data paint a cautionary picture for bulls. For traders, understanding these dynamics—and implementing disciplined risk management—is essential to navigating the next leg of PEPE’s journey.
Technical Analysis: A Fragile Defense at $0.0000096
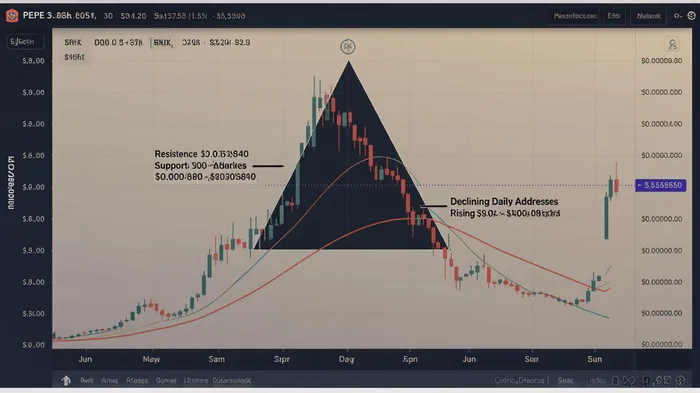
PEPE’s price is currently caught in a symmetrical triangle pattern, a classic consolidation formation that often precedes a breakout or breakdown. The immediate support level at $0.0000096 has become a focal point for traders, with analysts warning that a breach could trigger a 15–20% correction [1]. This level is not arbitrary: it represents the lower boundary of the triangle and a prior area of accumulation.
If bulls fail to defend this level, the next significant demand zone lies between $0.0000085 and $0.0000080, where the triangle’s trendline intersects with historical support [2]. A breakdown below $0.0000096 would invalidate the bullish case, exposing the price to further declines toward $0.00000587 or even $0.0000036, levels last seen during earlier bearish phases [3].
The RSI and MACD indicators, however, offer mixed signals. While the RSI hovers near neutral territory, the MACD shows bearish dominance, suggesting waning momentum for buyers [4]. This divergence highlights the precarious balance between short-term resilience and long-term bearish pressure.
On-Chain and Derivatives Data: A Bearish Imbalance
On-chain metrics reinforce the technical narrative. Daily active addresses have plummeted to fewer than 3,000, a stark contrast to the 27,500 peak observed during late 2024’s rally [1]. This decline signals reduced retail participation and a lack of broad-based demand. Meanwhile, exchange balances for PEPE have increased by 1.13%, indicating that large holders are preparing for potential selling [2].
Derivatives data adds another layer of concern. Long liquidations have surged to $326,000, dwarfing short liquidations of just $9,900 [1]. This imbalance suggests that leveraged long positions are at risk of cascading liquidations if the price breaks below key levels, accelerating downward momentum.
Risk Management: Navigating the Volatility
For traders holding or shorting PEPE, the current environment demands strict risk management. Here are three key strategies:
- Position Sizing: Given the high volatility, limit exposure to a small percentage of your portfolio. A 1–2% allocation to PEPE is prudent, especially with such a wide range of potential outcomes.
- Stop-Loss Placement: For long positions, place stop-loss orders just below the $0.0000096 support level. For short sellers, consider entering only after a confirmed breakdown, with stops above the triangle’s resistance at $0.000009640 [2].
- Hedging with Derivatives: Traders can hedge against unexpected rallies by using options or futures contracts. A bear call spread or a short futures position could mitigate losses if the price stabilizes or rebounds.
The Path Forward: A Crucial 48-Hour Window
The next 48 hours will be pivotal. A sustained close above $0.0000096 could reinvigorate bullish sentiment, potentially pushing the price toward the triangle’s upper boundary at $0.000009640 [2]. Conversely, a breakdown below $0.0000096 would likely trigger a cascade of stop-loss orders and force sellers to take control.
For now, the market is in a state of limbo. Traders must remain vigilant, balancing technical signals with on-chain and derivatives data. As always, volatility is the name of the game—but preparation is the key to survival.
Source:
[1] PEPE Faces 15% Downside Risk as Trading Volumes and On-Chain Activity Plunge [https://www.coindesk.com/markets/2025/09/04/pepe-faces-15-downside-risk-as-trading-volumes-and-on-chain-activity-plunge]
[2] PEPE Price Prediction: $0.000013-$0.000019 Target as Double-Bottom Pattern Eyes September Breakout [https://blockchain.news/news/20250904-price-prediction-target-pepe-0000013-0000019-as-double-bottom-pattern]
[3] PEPE Finds Support at $0.0000096 — Could This Spark a New Rally for Holders? [https://bravenewcoin.com/insights/pepe-pepe-price-prediction-pepe-finds-support-at-0-0000096-could-this-spark-a-new-rally-for-holders]
[4] PEPE Price Analysis: Meme Coin Shows Weak Bullish Signals Despite [https://blockchain.news/news/20250904-pepe-price-analysis-meme-coin-shows-weak-bullish-signals-despite]


Comentarios
Aún no hay comentarios