
PBDC: A Contrarian Play for Income Investors in a Volatile Rate Environment
Income investors face a dilemma: chase yield or prioritize capital safety? The Putnam BDC Income ETF (PBDC) presents a compelling case for the latter, offering a 9.66% trailing yield while navigating Federal Reserve uncertainty with a defensive edge. However, its near-term technicals warn of risks—creating a high-stakes opportunity for those willing to wait for a key support test.
The Fundamental Case: PBDC vs. BIZD
PBDC and the VanEck Vectors BDC Income ETF (BIZD) are often compared, but their risk profiles diverge sharply. While BIZD offers a higher 11.11% yield, its historical volatility is nightmarish—peaking at a -55.5% drawdown since inception compared to PBDC's -20.3% maximum loss. This stability isn't accidental: PBDC's active management focuses on lower-leverage BDCs with floating-rate exposure, shielding it from margin compression as rates peak.
Crucially, PBDC's expense ratio (6.79%) is 40% cheaper than BIZD's (10.92%), compounding its edge. Risk metrics like the Martin Ratio (1.12 vs. BIZD's 0.85) confirm PBDC's superior return per unit of risk. For retirees or income seekers who can't stomach 50% crashes, this ETF is a no-brainer—if the price holds.
Technical Weaknesses: Why the Near-Term Outlook is Murky
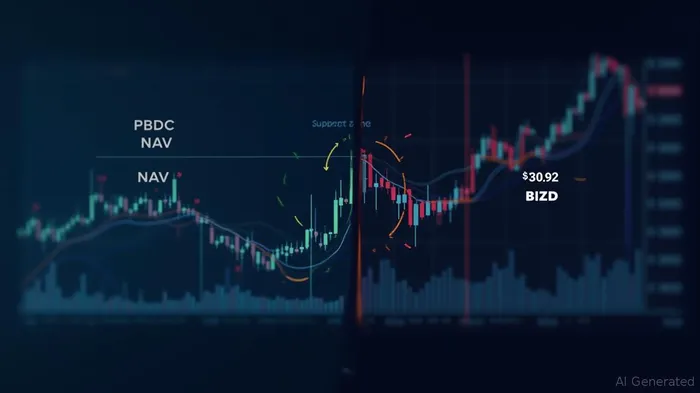
PBDC's chart isn't painting a bullish picture. The ETF has been in a bearish trend for weeks, trading below its 5-, 20-, and 50-day EMAs—a classic “death cross” setup. While its 50-day SMA (32.35) offers a flicker of hope, the RSI at 47.85 suggests oversold conditions, yet the technical rating leans toward a “Strong Sell” due to overwhelming bearish momentum.
The critical near-term test comes at the $30.92 support level—the last line of defense before a freefall toward $29.40. A break below $30.92 would invalidate PBDC's 3-month “wide and weak rising trend,” triggering a 7% drop to the next support. Meanwhile, the MACD's recent dip into negative territory hints at fading momentum.
The Contrarian Play: Wait for the Support Test
Here's the opportunity: PBDC's fundamentals scream “buy the dip,” but only if the $30.92 support holds. The ETF's 9.66% yield is still generous compared to 10-year Treasuries (3.2%), and its active management has outperformed BIZD over most time frames. However, investors should avoid chasing the dip now—wait for confirmation.
If PBDCPBDC-- bounces off $30.92 in the next two weeks, it could reclaim its 20-day SMA ($33.32) and signal a resumption of its sideways trend. The reward here is a potential 5% rebound to $33.50. But if it breaches $30.92? The downside risk spikes, with $29.40 becoming the next target—a 4.5% drop.
Investment Strategy: Patience Pays
Hold PBDC now if you already own it—avoid adding to positions until the support test. Consider a 5% allocation to PBDC only if it stabilizes at $30.92, using a stop-loss at $30.78. Avoid BIZD entirely unless you're willing to endure catastrophic volatility.
For the risk-tolerant, a 3% position in PBDC at $30.92 offers asymmetric upside: the ETF's 52-week high ($36.86) is 12% above current levels, and a Fed pivot on rates could spark a rally. But without a bounce from support, this remains a guessing game.
Final Take
PBDC is a diamond in the rough for income investors—but only if you're willing to let the dust settle. Its fundamentals justify a buy, but technicals demand a wait-and-see approach. The $30.92 level isn't just a number; it's the crossroads between PBDC's defensive appeal and the Fed's unpredictable dance. Cross it cautiously.

Comentarios
Aún no hay comentarios