
Nvidia's Valuation Bubble: Is It Time to Sell Before the Correction?
The debate over NVIDIA's (NVDA) valuation has intensified as the stock trades near record highs amid surging demand for AI infrastructure. While technical indicators suggest a bullish near-term outlook, fundamental and sector-level risks loom large. This analysis examines whether the current price reflects a sustainable growth trajectory or a speculative bubble primed for correction.
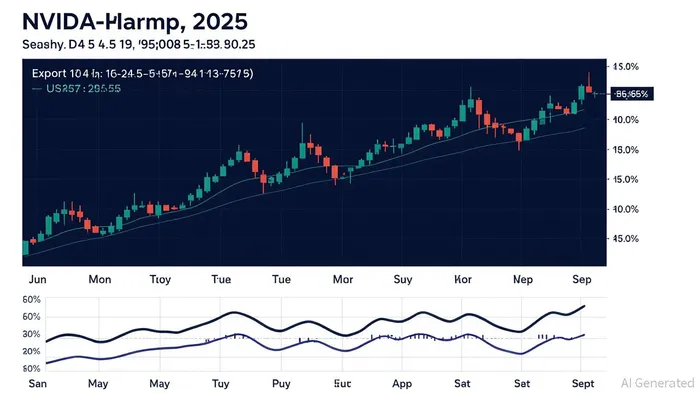
Technical Indicators: A Mixed Signal
NVIDIA's technical profile presents a paradox. Short-term momentum remains robust, with the 5-day, 50-day, and 200-day moving averages all trending upward, signaling a “Buy” signal for bulls [1]. The 14-day RSI stands at 71.098, nearing the overbought threshold of 70, which typically warns of potential short-term exhaustion [1]. However, the stock remains within BollingerBINI-- Bands, with the price currently at $174.88—closer to the lower band ($166.97) than the upper band ($187.15)—suggesting volatility but not extreme overbought conditions [2].
Yet, divergences emerge. The GF Value of $305.28, significantly below the current price, implies overvaluation, while the P/E ratio of 55.22 exceeds the industry average, raising concerns about earnings catching up to price [3]. These metrics highlight a tug-of-war between algorithmic optimism and valuation skepticism.
Earnings Sustainability: Margin Pressures and Geopolitical Risks
NVIDIA's Q1 2025 earnings report underscored both its dominance and vulnerabilities. Revenue surged 69% year-over-year to $44.06 billion, driven by the data center segment, which accounted for 89% of total sales [4]. However, gross margins contracted to 60.5% due to product transitions and export restrictions limiting H20 chip sales to China—a $8 billion revenue headwind [4]. The company's pivot to modified Blackwell chips for the Chinese market, while compliant with U.S. regulations, comes at the cost of lower pricing and margins [4].
Management projects margin recovery to 71.8% as Blackwell production scales, but this hinges on geopolitical stability. Export controls and China's accelerated domestic chip development pose structural risks, as highlighted by CEO Jensen Huang [4]. Meanwhile, the company's days sales of inventory (DSI) at 55 days—a record low—suggest strong demand, yet this could reverse if AI adoption slows or supply chains face further disruptions [4].
Sector Rotation Risks: AI Hype vs. Earnings Reality
The Information Technology sector's valuation has outpaced its fundamentals. As of Q2 2025, the sector accounted for 31.6% of the S&P 500's weighting but only 23% of net income, reflecting a 10-point gap between market cap growth and earnings [5]. NVIDIANVDA--, as a bellwether AI stock, has benefited from this trend, but the sector's concentration in speculative AI plays raises concerns about a correction.
Global AI spending is projected to hit $1.5 trillion in 2025, with NVIDIA's GPUs central to this growth [6]. However, the semiconductor industry faces a perfect storm: geopolitical tensions fragmenting supply chains, talent shortages, and rising R&D costs (now 52% of earnings) [7]. The U.S.-China trade war, coupled with U.S. tariffs on semiconductors and China's retaliatory measures, could disrupt NVIDIA's supply chain and access to critical markets [7].
Conclusion: Balancing Optimism and Caution
NVIDIA's technical indicators suggest a near-term “Buy” signal, but fundamental and sector-level risks cannot be ignored. The stock's valuation metrics—particularly the P/E ratio and GF Value—hint at overvaluation, while geopolitical and margin pressures threaten earnings sustainability. Investors must weigh the AI infrastructure boom against the fragility of global supply chains and regulatory headwinds.
For now, NVIDIA remains a cornerstone of the AI revolution, but the path forward is fraught with uncertainties. A prudent strategy might involve holding for the near term while monitoring key levels (e.g., the Fibonacci pivot at $177.71) and sector rotation trends. If the P/E ratio fails to normalize or geopolitical tensions escalate, a correction could be imminent. Historical backtests of RSI-based selling strategies (e.g., shorting when RSI > 70) have shown poor performance, with an average 9.73% price increase over 30 trading days [8], reinforcing the need for caution before relying on overbought signals alone.

Comentarios
Aún no hay comentarios