
Nvidia Earnings Preview - All eyes on the market general
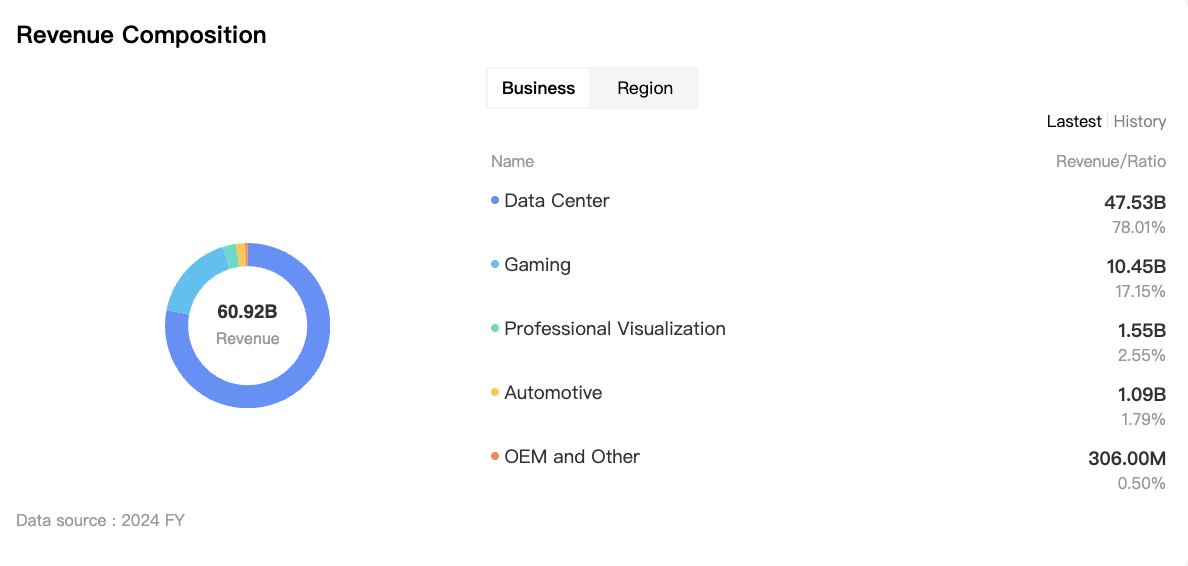
All eyes are on NVIDIA ($NVDA(NVDA)NVDA--) this week as it is the "market general" for stocks. Its earnings alone drove 42% and 37% of the S&P 500 year-over-year EPS growth in Q3 and Q4 2023, respectively, and accounted for 11% of the S&P 500's return over the past 12 months. For Q1 2024, NVIDIA's contribution to the S&P 500's EPS growth is estimated at approximately 40%, with its EPS and revenue projected to grow by 474% and 241%, respectively. NVDA will release its next earnings report on May 22, 2024, after the market closes. The consensus from FactSet projects earnings per share (EPS) at $5.60 and revenue at $24.59 billion. The earnings conference call is scheduled for 5:00 PM on the same day. NVIDIA's earnings report is expected to exceed expectations, with anticipated guidance raises potentially driving a significant stock price increase. The insatiable demand for NVIDIA's chips, consuming half of TSMC's ($TSM(TSM)TSM--) advanced chip packaging capacity, is supported by TSMC's plans to increase capacity fivefold by 2025, potentially enabling NVIDIA to achieve 80% higher sales than currently forecasted. Historically, NVIDIA has beaten earnings estimates 88% of the time, with notable EPS beats in recent quarters, and has averaged 7% guidance raises each quarter. This track record suggests strong fundamentals and the potential for market-beating returns if NVIDIA continues to perform at this level. In this report, we will examine NVIDIA's significance to the broader market and outline expectations for the upcoming quarter. We will review recent customer news and explain how it positively impacts NVDA. Additionally, we'll recap the prior quarter's performance and guidance to provide a clear understanding of investor expectations. The report includes analyst commentary and projections for the current quarter. Finally, we will compare NVDA to its peers in terms of valuation, revenue growth, and overall performance. The Importance of Market Generals NVDA is set to report its earnings tomorrow, May 22, after the market closes. The following day, May 23, is expected to see significant volatility in the stock market, but the direction of the movement is uncertain. While weak or in-line earnings might lead to a market selloff, especially given the recent sharp rise in May, even strong earnings might not trigger a surge in the tech sector. Last summer, Nvidia reported outstanding earnings, but the stock market declined the following day due to a run-up prior to the event, a scenario that shares similarities with the current situation. The market's response will depend on the pre-report conditions: a weak or flat market ahead of the report could lead to a substantial upside on good earnings, whereas a continued surge in the market might result in a more cautious reaction. A market general refers to a leading company or stock that significantly influences the direction and performance of the overall stock market. These companies are typically large, well-established, and have substantial market capitalizations. They often belong to key sectors that drive economic growth and investor sentiment. Due to their size and market presence, the performance of market generals can heavily impact major stock indices, such as the S&P 500 or the Dow Jones Industrial Average. When these companies perform well, they can lift the entire market, and conversely, poor performance can drag the market down. Market generals are often seen as bellwethers for the broader economy. Their financial health and growth prospects can provide insights into economic trends and the overall business environment. These companies often have a large base of institutional and retail investors. Positive news or strong performance from market generals can boost investor confidence and drive market rallies. Negative news, on the other hand, can lead to market sell-offs and increased volatility. Investors use them as benchmarks to evaluate the health and prospects of smaller companies or emerging sectors. NVIDIA's performance during recent bear markets underscores its significant impact as a market general. NVDA experienced substantial declines during major market downturns, often exceeding the losses of the broader S&P 500 and a balanced 60/40 portfolio. For instance, during the 2022 stagflation, NVDA dropped by 63% compared to the S&P's 28% decline. In the Great Recession, NVDA's value plummeted by 79%, while the S&P fell by 58%. The Tech Crash saw NVDA lose 87% of its value, significantly more than the S&P's 50% drop. On average, NVDA's decline across these bear markets was 54%, highlighting its vulnerability to market volatility and the substantial risk it poses to investors during downturns. The Upcoming Quarter Analysts are optimistic about NVIDIA's upcoming earnings report, expecting the company to exceed expectations and potentially raise guidance. Barclays highlighted the upside potential in NVDA Data Center GPU units, with a projected increase of 10% in the April quarter and over 20% in the July quarter. Barclays expects the company to capture incremental revenue due to pricing on H200, starting to ship in July, and maintains that supply chain checks point to significant revenue upside, estimating $1 billion in April and $2 billion in July. Other analysts echoed these positive sentiments, emphasizing NVIDIA's strong position in the AI market. BAML expects NVIDIA to maintain its strength versus consensus estimates, though they foresee potential near-term volatility due to quarterly deceleration ahead of the Blackwell launch and dependency on China for 2H growth. This was highlighted in a Financial Times story this morning which suggested Amazon ($AMZN(AMZN)AMZN--) could slow its orders in favor of waiting for the new GPUs. Piper and Wedbush see strong demand for NVIDIA's data center products, with Piper expecting the company to beat current revenue expectations by $1.5 billion to $2 billion for April and July. UBS and CitigroupI highlight the anticipation of a significant revenue increase in the upcoming quarters, driven by ongoing demand for Hopper GPUs and the expected launch of Blackwell GPUs. Overall, analysts remain positive about NVIDIA's prospects, citing strong demand, robust supply chain checks, and the company's leadership in AI technology as key drivers of growth. They anticipate that the company will continue to outperform and raise guidance, supporting a positive outlook for its stock. Recent Price Target Changes and Upgrades - Barclays: PT raised from $850 to $1,100, maintains Overweight - Stifel: PT raised from $910 to $1,085, maintains Buy - Truist: PT remains at $1,177, maintains Buy - Bank of America: Maintains Buy, top pick - Piper: PT remains at $1,050, maintains Overweight - Wedbush: PT remains at $1,000, maintains Outperform - UBS: Remains OW rated, expects higher guidance - Keybank: Remains OW rated, sees limited signs of demand pause Big Tech Customer Base Big tech giants profiting from AI are driving this demand, contributing to NVIDIA's potential growth, though management expects supply constraints until 2026. Meta, Microsoft, and Alphabet are among NVIDIA's biggest customers, each leveraging AI to drive significant growth. Meta announced that AI improved ad conversion rates, enabling them to raise ad prices by 11% and increase ad volumes by 20%, along with a $4 billion investment in AI for 2024. Microsoft reported that AI boosted Azure sales from 26% to 31% and announced a massive $115 billion Project Stargate initiative, which includes millions of training GPUs and is expected to be 1000 times more powerful than ChatGPT-4. Alphabet ($GOOG(GOOG)GOOG--) ($GOOGL(GOOGL)GOOGL--), during its I/O developer conference, highlighted 20 new AI features and stated that Google Cloud customers will soon have access to NVIDIA's state-of-the-art Blackwell GPUs. The demand for NVIDIA's products is exceptionally high, with their chips selling out as fast as they are produced. This high demand persists even with the restriction on sales of advanced chips to China. If these restrictions are lifted, the surge in sales is likely to continue. As major companies like Amazon also commit to extensive AI and cloud computing investments, NVIDIA's position in the market strengthens. Commentators note that despite the stock's surge, it remains relatively inexpensive based on projected 2025 EPS, with earnings advancing faster than the stock price. Q4 Earnings Recap Here are the highlights from NVIDIA's (NVDA) last quarter earnings report: - NVDA reported Q4 (Jan) earnings of $5.16 per share, beating the FactSet Consensus of $4.59 by $0.57. - Revenues rose 265.3% year-over-year to $22.1 billion, surpassing the FactSet Consensus of $20.4 billion. - Data Center: Revenue: $18.4 billion; Up 27% from the previous quarter, up 409% year-over-year. Drivers: Strong demand from enterprise software, consumer internet applications, automotive, financial services, and healthcare sectors.NVDA saw a significant decline in sales to China due to U.S. government licensing requirements. - Gaming: Revenue: $2.9 billion; Flat from the previous quarter, up 56% year-over-year. Drivers: Higher sell-in to partners and growing demand. - Professional Visualization: Revenue: $463 million; Up 11% from the previous quarter, up 105% year-over-year. Drivers: Higher sell-in to partners following normalization of channel inventory levels. - Automotive: Revenue: $281 million; Up 8% from the previous quarter, down 4% year-over-year. Drivers: Year-over-year decrease driven by AI Cockpit, offset by an increase in self-driving platforms. - Guidance and Forward-Looking Statements: - Q1 (Apr) Guidance: - Expected revenues: $24.0 billion +/- 2% (implying $23.52-24.48 billion) vs. $22.21 billion FactSet Consensus. - Expected non-GAAP gross margins: 77.0% +/- 50 bps. Market and Product Outlook: - Strong global demand for accelerated computing and generative AI. - Data Center platform driven by diverse demands from cloud-service providers, enterprise software, and consumer internet companies. - AI factories being built as part of next-generation modern data centers. - Approximately 40% of Data Center revenue in the past year attributed to AI inference. - Continued growth expected in vertical industries like automotive, financial services, and healthcare. - Anticipate sequential growth in Data Center and ProViz in Q1, partially offset by a seasonal decline in Gaming. - Supply of Hopper architecture products improving, but next-generation products expected to be supply constrained due to high demand. - On track to ramp H200 with initial shipments in the second quarter; H200 nearly doubles the inference performance of H100. - Expect gross margins to return to mid-70s percent range for the remainder of the year. Valuations Here's a summary of NVIDIA's (NVDA) valuations compared to its peers, focusing on P/E Non-GAAP (FY1), P/E Non-GAAP (FY2), Price/Sales (TTM), EV/Sales (FWD), and EV/EBITDA (FWD): P/E Non-GAAP (FY1): NVDA's P/E ratio is 37.31, higher than TSM (24.34), AVGO ($AVGO(AVGO)AVGO--) (29.93), QCOM ($QCOM(QCOM)QCOM--) (19.96), and TXN ($TXN(TXN)TXN--)(38.11), but lower than AMD ($AMD(AMD)AMD--) (47.32). P/E Non-GAAP (FY2): NVDA's P/E ratio is 29.48, higher than TSM (19.51), AVGO (24.49), QCOM (17.58), and TXN (30.28), but lower than AMD (29.98). Price/Sales (TTM): NVDA's price-to-sales ratio is 38.41, significantly higher than TSM (9.57), AVGO (15.41), AMD (11.69), QCOM (6.06), and TXN (10.77). EV/Sales (FWD): NVDA's enterprise value-to-sales ratio is 20.46, higher than TSM (7.58), AVGO (14.32), AMD (10.41), QCOM (5.80), and TXN (11.75). EV/EBITDA (FWD): NVDA's enterprise value-to-EBITDA ratio is 32.15, higher than TSM (15.00), AVGO (23.83), QCOM (15.26), and TXN (26.64), but lower than AMD (52.85). Overall, NVIDIA tends to have higher valuation ratios compared to its peers, reflecting strong market expectations for its future growth. NVDA FCF: Growth Comps Here's a summary of NVIDIA's (NVDA) growth metrics compared to its peers, focusing on Revenue Growth (YoY), Revenue Growth (FWD), EBITDA Growth (YoY), EBITDA Growth (FWD), and EPS Growth Diluted (YoY): Revenue Growth (YoY); NVDA: 125.85% compared to peers TSM ( -1.56%), AVGO (12.94%), AMD (-1.16%), QCOM (-11.35%), TXN ( -13.85%). NVDA's year-over-year revenue growth is significantly higher than all its peers, showcasing its strong performance. Revenue Growth (Projections): NVDA: (74.26%), TSM (11.31%), AVGO (11.42%), AMD (11.45%), QCOM ( -1.45%), TXN (-3.58%). NVDA's forward revenue growth is substantially higher than its peers, indicating robust expected growth. EBITDA Growth (YoY): NVDA (384.20%), TSM (-2.96%), AVGO (-2.49%), AMD (-3.52%), QCOM (-21.00%), TXN (-26.73%). NVDA's year-over-year EBITDA growth is exceptionally higher compared to its peers, reflecting its strong operational performance. EBITDA Growth (Projections): NVDA (151.41%), TSM (10.97%), AVGO (19.97%), AMD (9.64%), QCOM (-5.27%), TXN (-7.37%). NVDA's forward EBITDA growth is much higher than its peers, indicating strong expected operational efficiency. EPS Growth Diluted (YoY): NVDA (585.63%), TSM (-16.03%), AVGO (-10.92%), AMD (189.21%), QCOM (20.08%), TXN (-6.26%). NVDA's year-over-year diluted EPS growth is significantly higher than all its peers, reflecting its strong earnings performance. Overall, NVIDIA demonstrates superior growth metrics in revenue, EBITDA, and EPS compared to its peers, highlight its robust financial performance and strong market position. Performance Comps Here is the summary of the performance of NVDA and its peers for the specified time periods: 1-Month Price Performance: NVDA (24.38%), TSM (20.24%), AVGO (17.38%), AMD (13.43%), QCOM (25.46%), TXN (24.75%) YTD Price Performance: NVDA (91.39%), TSM (47.64%), AVGO (26.68%), AMD (12.83%), QCOM (36.74%), TXN (16.86%) 5-Year Price Performance: NVDA (2,398.32%), TSM (297.18%), AVGO (418.74%), AMD (523.43%), QCOM (158.10%), TXN (90.20%)


Unlock Market-Moving Insights.
Subscribe to PRO Articles.
Already have an account? Sign in
Unlock Market-Moving Insights.
Subscribe to PRO Articles.
Already have an account? Sign in
